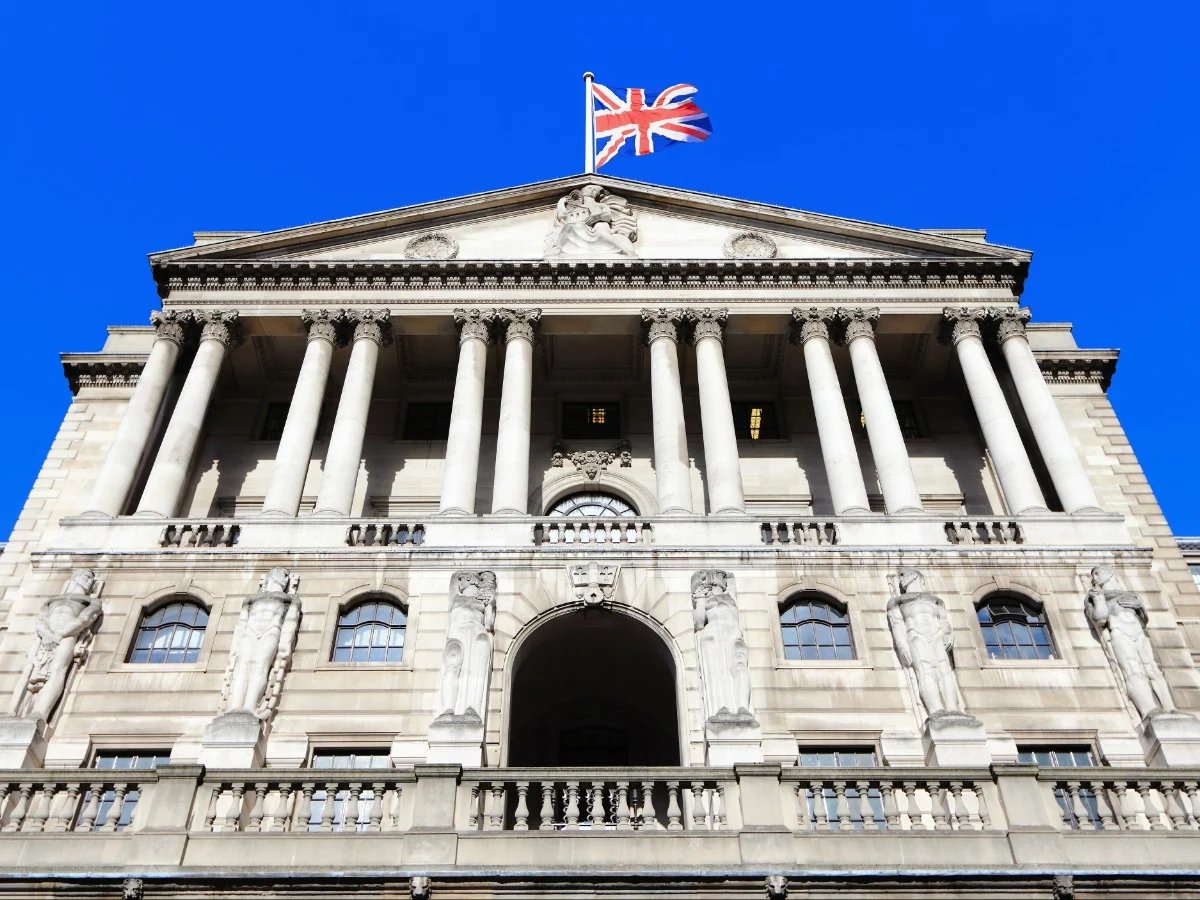



The next UK employment change figure is due on Tuesday 20 October 2026 at 07:00 BST, which is 09:00 Kyiv time. The Office for National Statistics (ONS) will publish Labour Force Survey (LFS) data for June to August 2026, according to the official GOV.UK release calendar. The previous reading was +67,000. The consensus is +20,000, according to Investing.com.
For the unemployment rate, the consensus shown by Trading Economics is 4.9%, unchanged from the previous reading. The release matters because the Bank of England meets on 5 November with Bank Rate at 3.75% and a possible hike to 4.00% under discussion.
The information in this article is provided for educational purposes only and does not constitute financial advice. Consult a financial advisor before making investment decisions.
This preview covers the history of the data and the latest labour market report. It then looks at forecasts and Bank of England pricing. The final sections cover GBP/USD levels and illustrative scenarios for the release.
UK Employment Change (3M): Quick Answers
The table below sums up what is known before the release. Every figure carries its date. Data and prices can change quickly.
Sources: GOV.UK, Trading Economics employment change, Trading Economics unemployment rate, Investing.com, data as of 19 October 2026. Past performance is not a reliable indicator of future results. Forecasts are not a reliable indicator of future performance.
What Time Is UK Employment Data Released?
The ONS publishes its labour market data at 07:00 UK time. UK clocks go back on 25 October, a small detail that has caught out many a calendar. For 20 October, Britain is still on summer time.
Source: GOV.UK statistics announcement, time-zone conversions by the author.
What Is Employment Change 3M?
Employment change (3M) is the change in the number of people in work in the UK. It compares the latest three months with the previous, non-overlapping three months. The figure comes from the Labour Force Survey, a household survey run by the ONS.
How the ONS Measures It
The LFS asks households about work and job search. It is the only source for the unemployment rate and for self-employment data. The ONS explains this in its September 2026 labour market overview.
The same release also includes HMRC payroll data and average weekly earnings. Vacancy figures come out at the same time. Traders read all of these together. The headline employment number is only one part of the picture.
Why the 3M Figure Moves Markets
Employment data feed into the Bank of England’s view of slack in the economy. More slack usually means less pressure on wages. Less pressure on wages tends to make it easier for inflation to fall.
Sterling has often moved on labour data when the numbers changed rate expectations. After the August release, ING noted that EUR/GBP opened firmer as the jobs data cooled hike expectations, as reported by FXStreet.
UK Employment Change History
LFS employment has risen in every release of 2026. However, the gains have become smaller since the spring. The table shows the headline change and the published forecast where one existed.
Source: Investing.com, UK Employment Change 3M/3M history, accessed 19 October 2026. Figures as first published and may since have been revised. Past performance is not a reliable indicator of future results.
What the Pattern Shows
The headline change has been positive for nine releases in a row. Each time a forecast was published, the actual number came in above it. The peak was +148,000 in the three months to March 2026.
Since then, growth has slowed to +83,000 and then +67,000. According to Trading Economics, the July figure was the smallest gain since February. A fall in part-time work partly offset growth in full-time jobs.
UK Labour Market Report for September 2026 in Numbers
The September release, published on 15 September, set the starting point for this week. The main figures are below.
Source: ONS, Labour market overview, UK: September 2026. Past performance is not a reliable indicator of future results.
HMRC Payrolls Keep Falling
Payrolled employees fell by 26,000 between July and August 2026, to 30.2 million. On the year, the flash estimate showed a fall of 145,000. The ONS says flash figures are provisional and are likely to be revised.
The ONS also says payrolls have generally fallen over the last two years. In its view, HMRC Real Time Information currently gives the most reliable measure of employees.
UK Wage Growth and Private Sector Pay
Regular pay growth was 3.5% in May to July 2026. It has been fairly stable for five three-month periods in a row. Total pay growth slowed to 3.9%, from 4.2%.
The gap between sectors is wide. Public sector regular pay grew by 6.3%, while private sector regular pay grew by 2.9%. The ONS links the public figure to the timing of pay awards. In real terms, regular pay grew by 0.8% using CPI.
Vacancies and the UK Claimant Count
Vacancies fell by 8,000 to 702,000 in June to August 2026. Outside the pandemic period, the last time vacancies were this low was August to October 2014. The ONS says small firms may be holding back on hiring because of higher labour costs.
The Claimant Count rose on the month and on the year to 1.692 million in August. This figure is also provisional.
LFS vs HMRC Payrolls: The Debate Over Two Labour Markets in the UK
The two main data sources tell different stories. The LFS shows employment rising. HMRC payrolls show the number of employees falling. This gap is the core of the current debate.
Source: ONS, Labour market overview, UK: September 2026. Past performance is not a reliable indicator of future results.
LFS Quality Caveats
The ONS says survey improvements since January 2024 mean recent LFS employment growth is likely to be temporarily higher. The improvements bring more responses from employed people. As a result, part of the recent rise may reflect better measurement.
The Bank of England also flagged an operational error in May and June. It temporarily reduced LFS sample sizes and increased the use of imputation, according to the September 2026 MPC minutes.
The margin of error is large. The Scottish Government summary of the same data gives a quarterly change of +66,000 with a range of plus or minus 178,000. That range is far wider than the headline change itself.
UK Employment Change Forecast for June to August 2026
Few forecasts have been published for this release. The table lists them.
Sources: Trading Economics employment change and Trading Economics unemployment rate, Investing.com, accessed 19 October 2026. Forecasts are not a reliable indicator of future performance.
The consensus of +20,000 would be the smallest gain in the releases shown above. The Trading Economics model estimate is higher, at +40,000. Recent releases have shown LFS gains alongside weak payrolls.
Leading Indicators: KPMG REC Report on Jobs
The latest KPMG and REC UK Report on Jobs, published on 10 October, pointed to a slight pick-up in hiring in September. The survey data were collected between 10 and 24 September.
Source: KPMG and REC, UK Report on Jobs, October 2026.
The survey covers September. The LFS figure due on Tuesday covers June to August, so the two do not overlap fully.
GDP and Business Activity
The economy grew by 0.1% in August, against forecasts of a contraction, as reported by The Irish News. Stronger activity can support hiring with a lag. It can also add to inflation concerns at the Bank of England.
Bank of England: Why the Jobs Data Matter for November
The Monetary Policy Committee held Bank Rate at 3.75% on 17 September. The vote was 6-3. Three members preferred a 0.25 percentage point increase to 4%.
Source: Bank of England, Monetary Policy Summary and minutes, September 2026.
The Inflation Backdrop
CPI inflation rose to 3.1% in August, according to the September minutes. Services inflation was 3.4%. The Bank expects CPI to reach around 3.75% in the fourth quarter of 2026 and slightly above 4% in the first quarter of 2027.
The minutes said there had been little evidence so far of material second-round effects in wage-setting. They also said labour demand remained weak, with a margin of slack in the labour market. This is why the jobs data carry so much weight.
Catherine Mann warned on 6 October that inflation could become further entrenched, as reported by Hargreaves Lansdown. She has voted for a hike since July, according to Trading Economics.
Market Pricing and Bank Views
After the September meeting, markets priced a 63% chance of a November hike, according to LSEG data cited by Reuters via Gulf Times. Pricing has moved since then. After the August GDP data, Trading Economics said expectations of a possible hike next month had firmed.
Bank economists are divided. The table sums up the published views.
Sources: Reuters via Gulf Times, Pound Sterling Live (ING), Pound Sterling Live (HSBC), FXStreet (Commerzbank). Forecasts are not a reliable indicator of future performance.
The LFS headline has beaten every published forecast in 2026, yet its margin of error is plus or minus 178,000. Markets may give more weight to payrolls and pay than to the headline employment change.
Commerzbank’s Michael Pfister said the labour market remained weak, which made heavy tightening a hard decision, as quoted by FXStreet. HSBC expected the softer labour market to keep the Bank on hold, according to Pound Sterling Live.
GBP/USD Today: Market Snapshot
GBP/USD rebounded from its 2026 low in mid-October. The table shows the latest levels with their dates.
Sources: Pound Sterling Live, GBP/USD 2026, Pound Sterling Live, EUR/GBP 2026, Trading Economics gilt yields, Bank of England. Past performance is not a reliable indicator of future results.
What Moved Sterling in October
Sterling slid in late September and early October. Higher energy prices and gilt-market stress before the Budget weighed on it, according to Trading Economics. A firm US dollar added to the pressure. On 14 October, GBP/USD touched 1.3137, its lowest level of 2026 in Pound Sterling Live data.
The bounce came after the August GDP data. On 16 October, the pound climbed to around $1.333, its strongest level since 22 September, according to Trading Economics.
GBP/USD Technical Analysis
The levels below come from daily closes between 1 July and 16 October 2026. They were calculated by the author from Pound Sterling Live data and are shown for illustration only.
Source: author’s calculations from Pound Sterling Live daily GBP/USD data. Past performance is not a reliable indicator of future results.
Indicators and Structure
The 14-day RSI was about 52.5 on 16 October, which is a neutral reading. On a closing basis, the August high was 1.3648. The September closing high of 1.3547 was lower. The October closing high of 1.3329 was lower again.
GBP/USD is back above its 10-day and 20-day averages. It is still below the 50-day average at 1.3418. In technical analysis, a daily close above a 50-day average is often read as a sign that a downtrend is losing force. A break below 1.3137 could bring 1.3000 into view.
GBP/USD Five-Year Performance
Recent price moves are only a small part of the longer picture. The table shows year-end closes and annual changes for the last five full calendar years.
Source: Pound Sterling Live 2021, 2022, 2023, 2024, 2025, 2026. Annual changes calculated by the author from year-end closes, using 1.3667 as the 2020 base (a 1 January 2021 holiday print, so the 2021 change is approximate). Past performance is not a reliable indicator of future results.
EUR/GBP and Gilt Yields
The jobs data can also move sterling against the euro. EUR/GBP traded as low as 0.8397 on 19 October, according to Pound Sterling Live. A lower EUR/GBP means a stronger pound against the euro.
ING named the pound its preferred G10 currency outside the US dollar on 14 October. It flagged an outside risk to the 0.8400 area while the French budget remained unresolved, as reported by Pound Sterling Live.
UK 10 Year Gilt Yield
The UK 10-year gilt yield was 5.38% on 16 October. On 14 October it reached 5.46%, close to its highest level since July 2007, according to Trading Economics.
Source: Trading Economics, UK gilt yields news. Past performance is not a reliable indicator of future results.
A weak jobs report could pull short-dated gilt yields lower if it reduces hike expectations. A strong report could do the opposite. The Budget on 28 October adds a separate source of risk for gilts.
Scenarios for the 20 October Release
The scenarios below are illustrative. They show how markets could react under different outcomes. They are based on the levels and views above and are not predictions.
Scenarios prepared by the author from the data cited in this article. Forecasts are not a reliable indicator of future performance.
Hawkish Scenario
A strong headline with stable payrolls could support the case for a November hike. In that case, sterling could find support against the dollar and the euro. Short-dated gilt yields could rise.
Base Case Scenario
A gain close to the +20,000 consensus with unemployment at 4.9% would be in line with expectations. The market reaction could be limited. Attention would then move to the September CPI data, due at 07:00 BST on 21 October.
Dovish Scenario
A first negative LFS reading since the three months to October 2025 (-16,000, according to Investing.com) could revive the HSBC and Commerzbank view that the Bank may under-deliver. Weak private sector pay would add to that case. GBP/USD could then come under pressure.
A strong LFS headline with weak payrolls could also fade quickly. The LFS quality issues mean markets may trust the payroll and pay data more.
Key Risks Around the Release
Other events can outweigh the jobs data. The table compares factors that may support sterling with factors that may weigh on it.
Sources: Bank of England, ONS, The Irish News, Trading Economics, Pound Sterling Live (ING), Pound Sterling Live (HSBC), FXStreet (Commerzbank).
Energy Prices and Geopolitics
The Bank of England said protracted conflict in the Middle East had pushed energy prices higher. Brent reached $106 per barrel at the close on 14 September, according to the September minutes. Further moves in oil can change inflation expectations quickly.
Fiscal and Political Risk
Chancellor John Healey presents his first Budget on 28 October, as confirmed in coverage by The Dirt. City AM estimates cited there put the fiscal gap at £22 billion or more. Gilt markets and sterling may react to any sign of fiscal slippage.
US Data and the Federal Reserve
GBP/USD also depends on the US dollar. The Federal Reserve meets on 27 and 28 October, according to its October 2026 calendar. A surprise from the Fed could outweigh the UK jobs data.
Economic Calendar: Key UK and US Events
The jobs data open a busy three weeks for sterling. The times below are UK times, with Kyiv times shown alongside.
Sources: GOV.UK, ONS CPI release, The Dirt, Federal Reserve, Bank of England, ONS November release. Time-zone conversions by the author.
The Admirals Forex calendar lists these events with live times for each time zone.
How to Trade UK Jobs Data: What Traders Often Watch
Data releases can bring sharp moves and wider spreads. Traders often look beyond the headline number. The points below describe what market participants commonly monitor.
- Traders often compare the LFS headline with the HMRC payroll change.
- Many market participants watch private sector regular pay as a guide to wage pressure.
- Revisions to earlier months can matter as much as the new figure.
- Some traders wait for the first minutes of price action before forming a view.
- Moves in short-dated gilt yields often show how rate expectations are changing.
- The CPI data on 21 October may confirm or reverse the reaction to the jobs report.
Source: author’s summary based on the ONS September 2026 bulletin.
For background on how macro data drive currencies, see this introduction to Forex fundamental analysis. A wider view of the UK outlook is in the article on the UK recession risk in 2026. The US side of the pair is covered in the Fed rate decision preview for October 2026.
Risk Management Around Data Releases
Prices can gap at 07:00 when the data come out. Stop-loss orders may be filled at a worse price than set during fast markets. Many traders manage risk by using smaller position sizes around major releases.
Leverage magnifies both gains and losses. The guide to Forex risk management explains common methods to manage risk.
Trading GBP/USD CFDs with Admiral Markets
Admiral Markets offers CFDs on Forex pairs such as GBP/USD and EUR/GBP. Details are on the Forex CFD product page. Trading is available on MetaTrader 5.
A demo account uses virtual funds, and results may differ from live trading. It lets traders practise around data releases without risking capital.
CFDs are complex instruments and come with a high risk of losing money rapidly due to leverage. You should consider whether you understand how CFDs work and whether you can afford to take the high risk of losing your money.
Conclusion
The UK jobs report on 20 October arrives at a sensitive time. The previous LFS gain was +67,000, and the consensus is +20,000. The unemployment consensus is 4.9%.
The LFS has come in above every published forecast this year. Payrolls have fallen over the same period. Vacancies are at a 12-year low outside the pandemic. Markets may focus on payrolls and pay as much as the headline.
The data come before CPI on 21 October and the Budget on 28 October. The Bank of England then decides on 5 November. Each event could change the picture for GBP/USD.
Frequently Asked Questions
What is the UK employment change 3M?
It measures the change in the number of people in work over three months, compared with the previous three months.
When is the next UK employment change release?
The ONS releases the data on Tuesday 20 October 2026 at 07:00 BST, which is 09:00 Kyiv time.
What was the previous UK employment change?
Employment rose by 67,000 in the three months to July 2026, taking the total to 34.478 million people.
Is there a consensus forecast for UK employment change?
Investing.com and Trading Economics show a consensus of +20,000. The Trading Economics model estimate is +40,000.
Why is UK employment rising while payrolls fall?
The LFS survey and HMRC tax records measure different groups. Survey improvements may also be lifting recent LFS employment growth.
How does UK employment change affect GBP?
Stronger data can raise Bank of England hike expectations and may support sterling. Weaker data can have the opposite effect.
Will the Bank of England hike in November?
Markets and economists are divided. Some banks expect a hike on 5 November, while others expect the Bank to hold.
Some of the content on this page was created with the help of automated tools. All final text has been reviewed by Admiral Markets and is under its editorial responsibility.
The given data provides additional information regarding all analysis, estimates, prognosis, forecasts, market reviews, weekly outlooks or other similar assessments or information (hereinafter “Analysis”) published on the websites of Admiral Markets investment firms operating under the Admiral Markets trademark (hereinafter “Admiral Markets”) Before making any investment decisions please pay close attention to the following:
- This is a marketing communication. The content is published for informative purposes only and is in no way to be construed as investment advice or recommendation. It has not been prepared in accordance with legal requirements designed to promote the independence of investment research, and that it is not subject to any prohibition on dealing ahead of the dissemination of investment research.
- Any investment decision is made by each client alone whereas Admiral Markets shall not be responsible for any loss or damage arising from any such decision, whether or not based on the content.
- With view to protecting the interests of our clients and the objectivity of the Analysis, Admiral Markets has established relevant internal procedures for prevention and management of conflicts of interest.
- The Analysis is prepared by an analyst (hereinafter “Author”). The Author Admiral Markets is an employee /a contractor for Admiral Markets. This content is a marketing communication and does not constitute independent financial research.
- Whilst every reasonable effort is taken to ensure that all sources of the content are reliable and that all information is presented, as much as possible, in an understandable, timely, precise and complete manner, Admiral Markets does not guarantee the accuracy or completeness of any information contained within the Analysis.
- Any kind of past or modelled performance of financial instruments indicated within the content should not be construed as an express or implied promise, guarantee or implication by Admiral Markets for any future performance. The value of the financial instrument may both increase and decrease and the preservation of the asset value is not guaranteed.
- Leveraged products (including contracts for difference) are speculative in nature and may result in losses or profit. Before you start trading, please ensure that you fully understand the risks involved.
Sources
- UK Labour Market: October 2026, GOV.UK, accessed 19 October 2026.
- Labour market overview, UK: September 2026, Office for National Statistics, accessed 19 October 2026.
- Consumer price inflation, UK: September 2026 time series, Office for National Statistics, accessed 19 October 2026.
- UK Labour Market: November 2026, Office for National Statistics, accessed 19 October 2026.
- Labour Market Trends: September 2026, Scottish Government, accessed 19 October 2026.
- Bank Rate maintained at 3.75%, September 2026 Monetary Policy Summary and Minutes, Bank of England, accessed 19 October 2026.
- Calendar: October 2026, Federal Reserve Board, accessed 19 October 2026.
- United Kingdom Employment Change, Trading Economics, accessed 19 October 2026.
- UK Employment Posts Smallest Gain in 5 Months, Trading Economics, accessed 19 October 2026.
- United Kingdom Unemployment Rate, Trading Economics, accessed 19 October 2026.
- Sterling Holds Above $1.32 as UK Inflation Concerns Persist, Trading Economics, accessed 19 October 2026.
- UK Gilt Yields Climb as Oil Fuels Inflation Fears, Trading Economics, accessed 19 October 2026.
- United Kingdom Employment Change 3M/3M, Investing.com, accessed 19 October 2026.
- KPMG and REC, UK Report on Jobs October 2026, KPMG, accessed 19 October 2026.
- Barclays, UBS back BoE hikes as inflation risks mount, Gulf Times (Reuters), accessed 19 October 2026.
- British Pound: Softer as jobs data cools rate hike expectations, ING, FXStreet, accessed 19 October 2026.
- British Pound: Fragile labour market clouds BoE hikes, Commerzbank, FXStreet, accessed 19 October 2026.
- Pound-Dollar a Sell: HSBC, Pound Sterling Live, accessed 19 October 2026.
- Pound-to-Euro Forecast Upgraded at ING as Sterling Now Preferred, Pound Sterling Live, accessed 19 October 2026.
- British Pound-U.S. Dollar History: 2026, Pound Sterling Live, accessed 19 October 2026.
- British Pound-U.S. Dollar History: 2025, Pound Sterling Live, accessed 19 October 2026.
- British Pound-U.S. Dollar History: 2024, Pound Sterling Live, accessed 19 October 2026.
- British Pound-U.S. Dollar History: 2023, Pound Sterling Live, accessed 19 October 2026.
- British Pound-U.S. Dollar History: 2022, Pound Sterling Live, accessed 19 October 2026.
- British Pound-U.S. Dollar History: 2021, Pound Sterling Live, accessed 19 October 2026.
- Euro-British Pound History: 2026, Pound Sterling Live, accessed 19 October 2026.
- BoE’s Mann warns UK inflation could become further entrenched, Hargreaves Lansdown, accessed 19 October 2026.
- UK economy unexpectedly grows 0.1% in August, The Irish News, accessed 19 October 2026.
- Autumn Budget 2026: John Healey confirms 28 October date, The Dirt, accessed 19 October 2026.