

On November 3, 2026, the Reserve Bank of Australia (RBA) raised its policy interest rate from 4.60% to 4.85%. This was the fifth rate hike this year and the highest level in 18 years. However, immediately after the announcement, the AUD/JPY pair fell 35 pips in two minutes and dropped back to the same level during the Governor’s press conference.
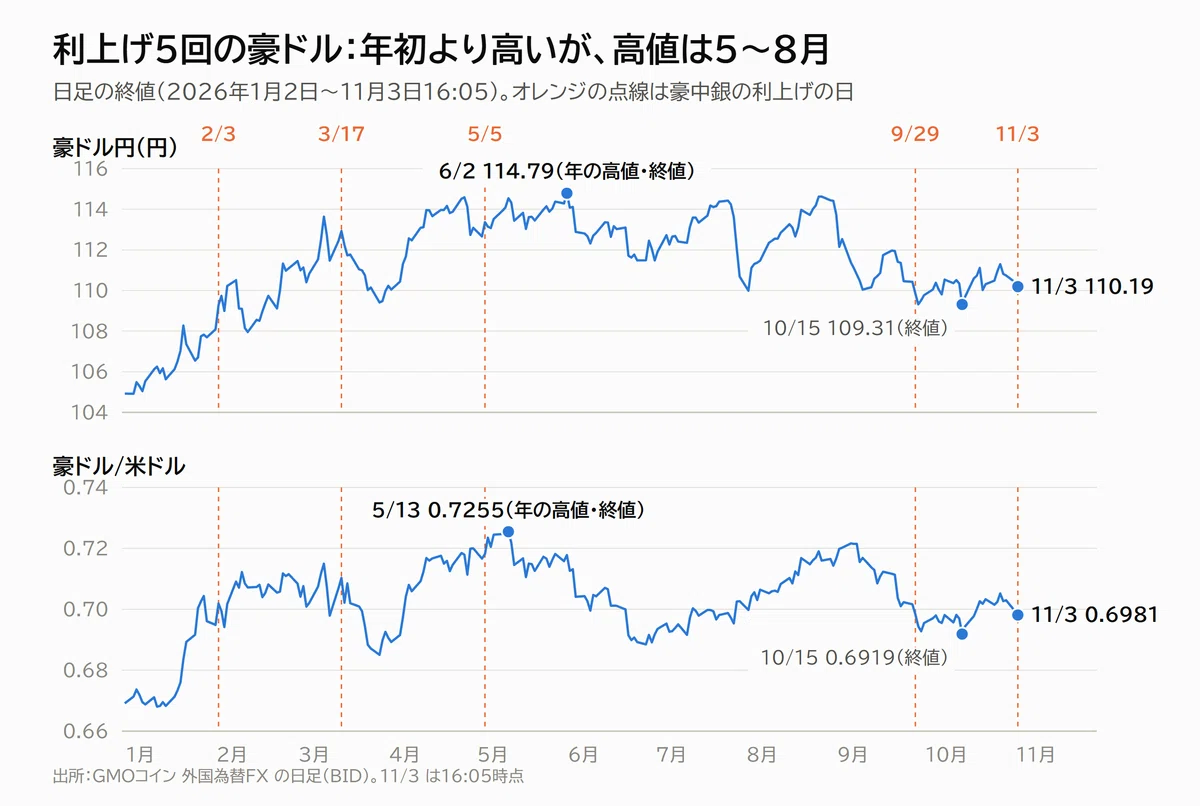
Over the past year, the Australian dollar has been the strongest of the eight major currencies (+7.6% against the average of the other seven). It has been supported by interest rate hikes. Now that those hikes are being interpreted as potentially coming to an end, is the Australian dollar heading for a trend reversal? Based on data as of November 3, I will organize the following five points.
• What changed at the RBA on November 3?
• In terms of price action, has it already reversed?
• How did the Australian dollar move after past ‘final rate hikes’?
• What does ‘record high speculative net shorts’ mean?
• Have commonly used reversal signs worked in the past?
Finally, I will record the price benchmarks as of November 3 for reference. This is not a recommendation for any specific trade.
1. Sold despite a rate hike: What happened on November 3
The decision at 12:30 (JST) was a rate hike, but the content was significantly different from September.
• The vote was 6 to 3. Three members argued for keeping rates on hold. In September, the vote was unanimous.
• The phrase ‘further increases may be required’ was removed from the statement. This phrasing was present in the September statement.
• The inflation outlook was raised, and the unemployment rate outlook was also raised. Headline inflation is projected to be 4.5% at the end of 2026. It will take until the second half of 2027 to fall to the upper limit of the target (2-3%), which is about three quarters later than the August forecast. Meanwhile, the unemployment rate is projected to be 4.9% at the end of 2027 and 5.1% at the end of 2028, about 0.25 percentage points higher than the August forecast.
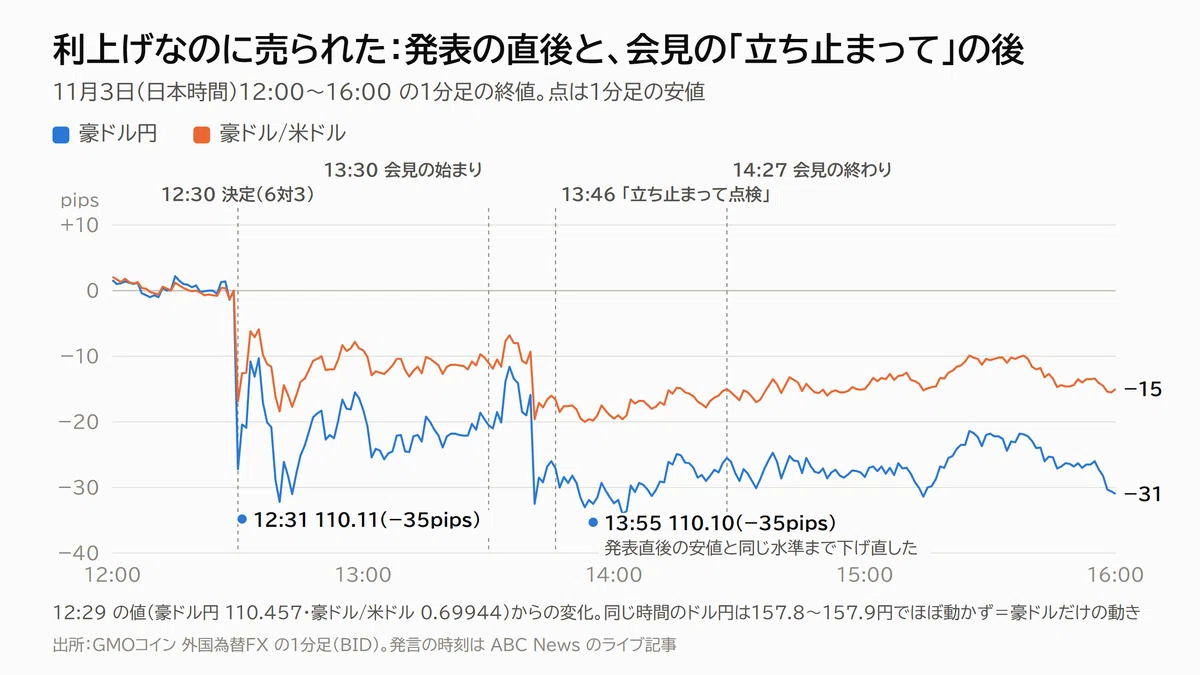
The AUD/JPY pair fell from 110.457 yen at 12:29 to 110.11 yen (-35 pips) at 12:31, two minutes after the announcement. The AUD/USD pair also fell to 0.6973 (-22 pips). The USD/JPY pair remained almost unchanged at 157.8-157.9 yen during the same period, indicating this was a move specific to the Australian dollar.
Governor’s press conference: ‘I don’t know what the next move will be’
At the press conference starting at 13:30, when asked if the bank had entered a period of holding rates steady, Governor Bullock replied, ‘Please don’t read anything special into it. I don’t know what the next move will be.’ She continued by saying the following (translated from ABC News live coverage):
• The five rate hikes are already having an effect. It is a good time to pause and see if the data matches the outlook.
• Inflation risks are still slightly tilted to the upside.
• If possible, I would like to avoid driving the economy into a recession.
It was explained that the three members who argued for holding rates steady placed significant weight on the decline in housing, the rise in the unemployment rate, and the fact that wage growth is not accelerating. The number of employed persons in September fell by 39,000 from the previous month, and the unemployment rate rose to 4.7%. The wage index was up 3.2% year-on-year in the April-June quarter.
The AUD/JPY pair recovered to 110.37 yen early in the press conference, but after the ‘pause’ comment, it fell back to 110.10 yen at 13:55, the same level as the low immediately after the announcement. As of 16:05, it is at 110.19 yen.
Private sector reactions included UBS calling it ‘clearly dovish’ and Capital Economics stating, ‘The rate hikes are over. Rate cuts will start from the end of 2027.’ Prior to the decision, three of Australia’s four major banks were already forecasting rate cuts starting around August 2027 (ANZ predicted around November).
2. ‘AUD strength on rate hikes’ has stopped working
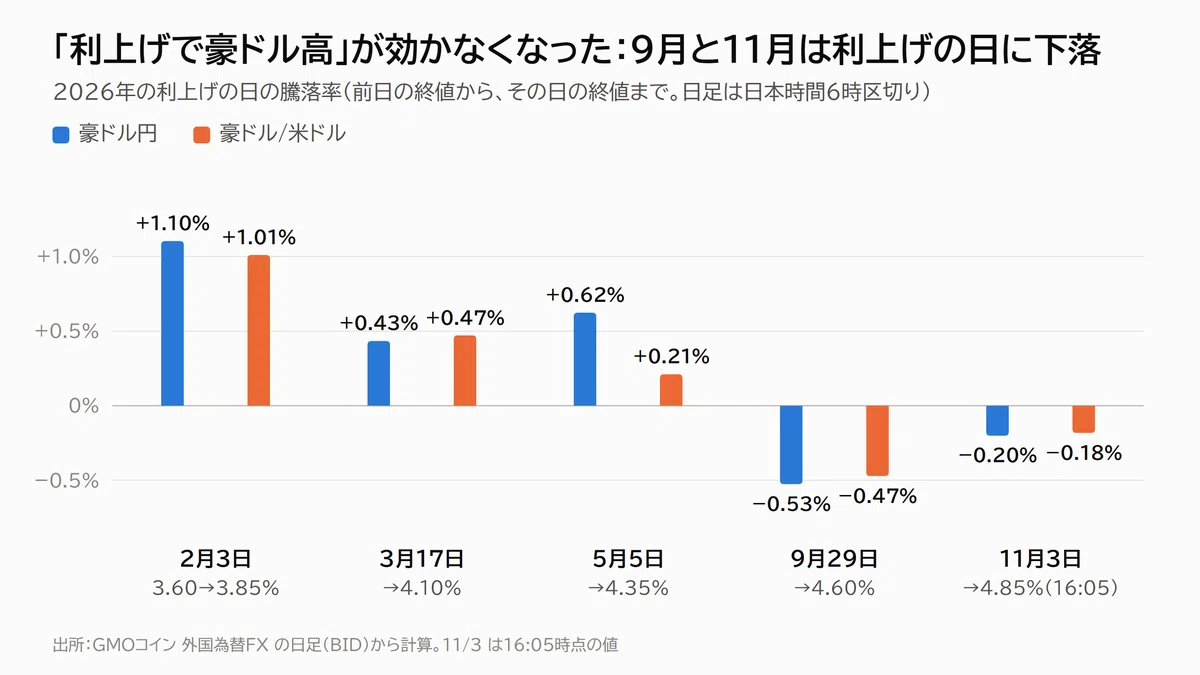
The AUD/JPY pair rose on the days of the five rate hikes this year: +1.10% in February, +0.43% in March, and +0.62% in May. However, it fell in September (-0.53%) and November (-0.20% as of 16:05), meaning it has fallen on the last two occasions. The AUD/USD pair followed the same pattern (+1.01%, +0.47%, +0.21%, -0.47%, -0.18%).
On September 29, even though the Governor said in the press conference that ‘we will raise rates again if necessary,’ the AUD/USD pair ended the day below 0.70. The Australian dollar is becoming less responsive to the material of interest rate hikes.
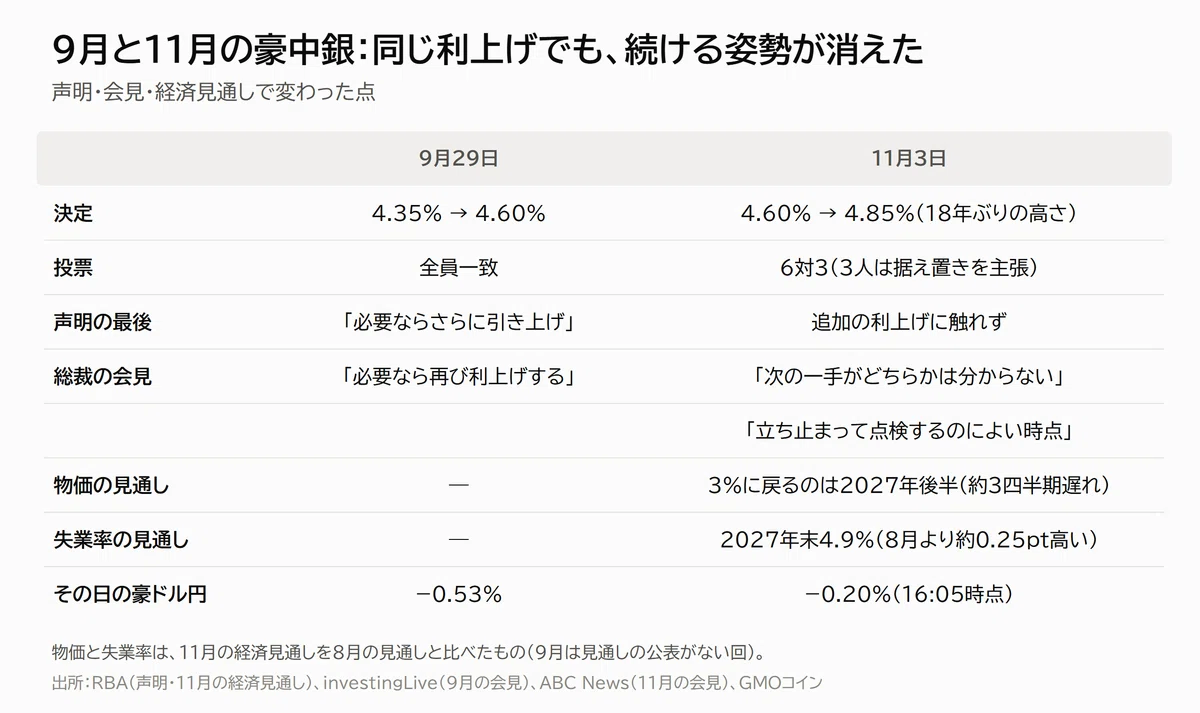
Comparing September and November, what changed is the ‘stance on continuing rate hikes.’ Even with the same 0.25% rate hike, the voting, the wording of the statement, and the comments at the press conference all weakened. However, the Governor also dismissed the view of rate cuts, so it is not decided that ‘the next move is a rate cut.’
3. In terms of price action, the signs of a reversal are all there
The patterns for AUD/JPY and AUD/USD are slightly different.
AUD/JPY: Continued Lower Lows Since June
• From April to September, the monthly high was between 114.6 and 115.0 yen, hitting a ceiling for six consecutive months.
• Monthly lows have been falling for five consecutive months: June 111.24 yen → July 110.60 yen → August 109.23 yen → September 108.89 yen → October 108.63 yen.
• Three commonly used reversal signs have already appeared: it fell below the 200-day moving average on September 11, hit a six-month low on September 30, and the 50-day line crossed below the 200-day line on October 21 (a dead cross; all determined by ECB reference rates).
• As of November 3, it is below all moving averages: 20-day, 50-day, 100-day, and 200-day.
AUD/USD: Trading Range of 0.68–0.73 Since March
• It has been moving within the 0.683–0.728 range since March, and has not broken the March low (0.6833).
• The October high of 0.7068 is lower than the highs in May (0.7278) and September (0.7238), indicating heavy overhead resistance.
• It fell below the 200-day line on September 29, but the 50-day line (0.7057) and 200-day line (0.7056) are at almost the same level, so a dead cross has not yet occurred.
The reason AUD/JPY looks weaker is that it includes the impact of a stronger yen. Of the -4.0% decline in AUD/JPY from the year’s high on June 2 (closing price 114.79 yen) to November 3, about 1.3% was due to the decline in USD/JPY (yen appreciation), while the decline in AUD/USD was -2.7%.
4. The Past Seven ‘Final Rate Hikes’: The AUD High Came After Six of Them
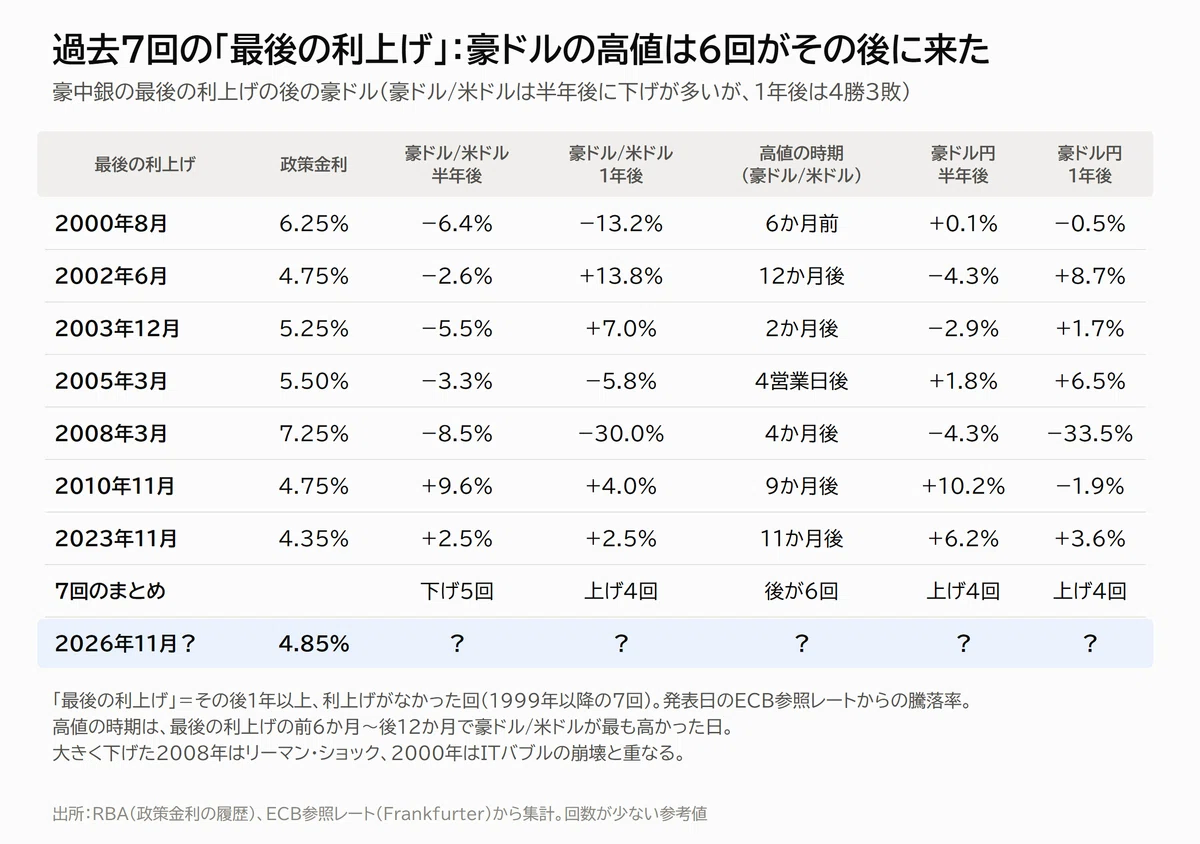
Since 1999, there have been seven ‘final rate hikes’ by the RBA where there were no further hikes for at least a year (August 2000, June 2002, December 2003, March 2005, March 2008, November 2010, and November 2023). I looked at the subsequent AUD performance using daily ECB reference rates.
• Highs often come after the final rate hike. In the 1.5-year window before and after, the day AUD/USD was at its highest was after the final rate hike in 6 out of 7 cases (between 4 business days and 12 months later). The only time it came before was in 2000.
• Declines are common six months later. AUD/USD was down in 5 out of 7 cases six months later (average -2.0%). AUD/JPY had 4 wins and 3 losses, showing no clear trend.
• One year later, it was 4 wins and 3 losses. The cases with significant declines were 2008, which coincided with the Lehman Shock (-30.0%), and 2000, which coincided with the bursting of the IT bubble (-13.2%).
• November 2023 is the closest shape to the current situation. While raising rates, the phrasing regarding additional hikes was softened from ‘some further tightening may be required’ to ‘whether further tightening is required will depend on the data,’ and AUD/USD was -1.2% that day. However, one month later it was +2.4%, and both six months and one year later it was +2.5%. During this period, expectations for rate cuts in the US strengthened, and the dollar was sold.
Reading the ‘final rate hike’ as a signal that ‘the interest rate tailwind has stopped and we are entering a phase driven by other factors’ fits the past data better than reading it as a signal of an AUD ceiling. Other factors are mainly US interest rates, the dollar, and stocks.
Also, you can only know if it was the final one in hindsight. There are examples like November 2006, June 2023, and May 2026 where it looked like it had stopped, but rate hikes resumed a few months later.
5. The Content of ‘Record Speculative Short Positions’
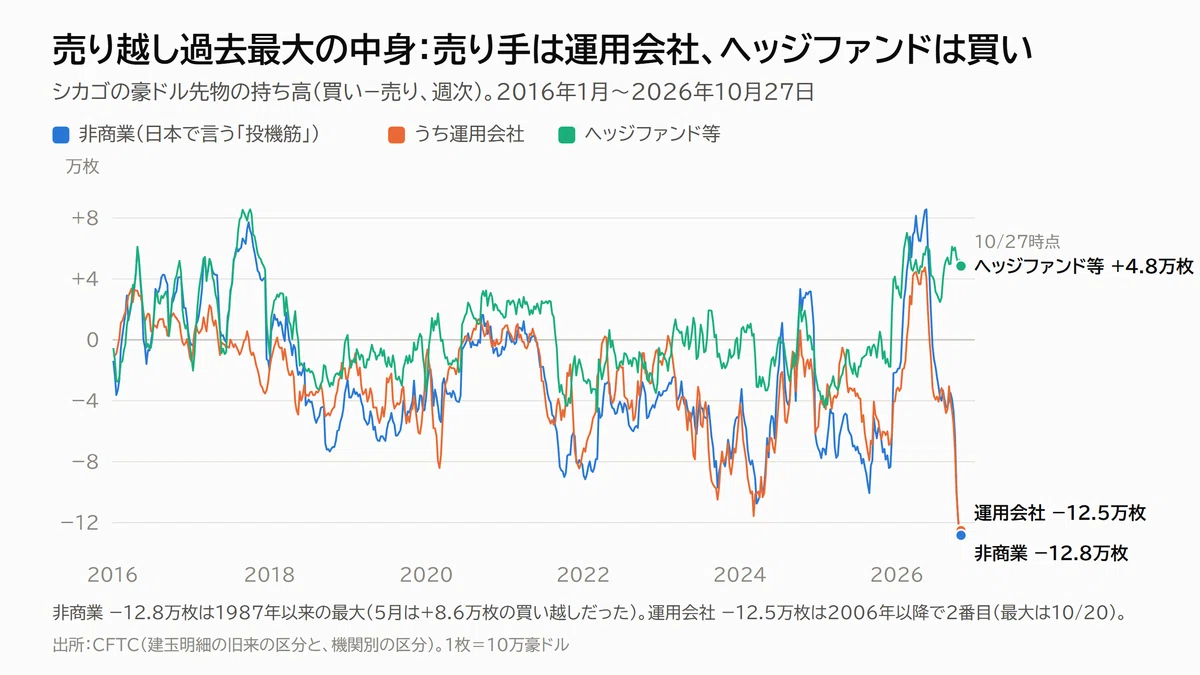
In Chicago AUD futures, ‘non-commercial’ positions, often translated as ‘speculators’ in Japan, were net short by 128,000 contracts as of October 27. This is the largest since 1987 and about three times the median of the last 10 years (39,000 net short). Since they were net long by 86,000 contracts in May, this means they shifted to a short position of over 210,000 contracts in five months. It surged in six weeks from the 39,000 net short in mid-September, spanning the September 29 rate hike.
However, when broken down by institutional type, the content looks different from the image.
• It is asset managers (pension funds, insurance, investment trusts, etc.) that are selling. They are net short by 125,000 contracts, the second largest after October 20 (129,000), which was the largest since 2006.
• Hedge funds and others are actually net long by 48,000 contracts.
• Bloomberg reported on October 26 that this is an ‘insurance’ move to sell the risk-sensitive AUD due to tensions in the Middle East and anxiety over AI-related stocks. Asset managers also had record net short positions in the Mexican peso, while the yen was net long by 91,000 contracts. This is a common portfolio structure when preparing for a stock market decline.
‘High Short Positions Mean It’s Hard to Fall’ Cannot Be Verified
• From the week when non-commercial net shorts hit a 3-year high (since 1999; consecutive weeks are counted as one, totaling 11 cases where 4 weeks later can be measured), AUD/USD was up 4 weeks later in only 4 cases (36%), which is lower than the 52% for all weeks. 13 weeks later, it was up in 7 cases (64%), but the average rate of return was negative (-0.5%).
• It took a median of 11 weeks (3–23 weeks) for large net short positions by asset managers (3-year high) to be halved. During that time, AUD/USD rose in 6 out of 8 cases, but in March 2020, it was bought back amid a crash, and during that time the AUD was -9.9%.
Buybacks occur either ‘when worries come true (crash)’ or ‘when worries disappear.’ If it’s the former, the AUD is bought back while falling. You cannot definitively say, ‘Because short positions are at a record high, it will eventually rise due to buybacks.’ In fact, one could view the net long positions held by hedge funds as potential selling for liquidation if stocks collapse.
6. It Is Stocks, Not the RBA, That Will Break the AUD
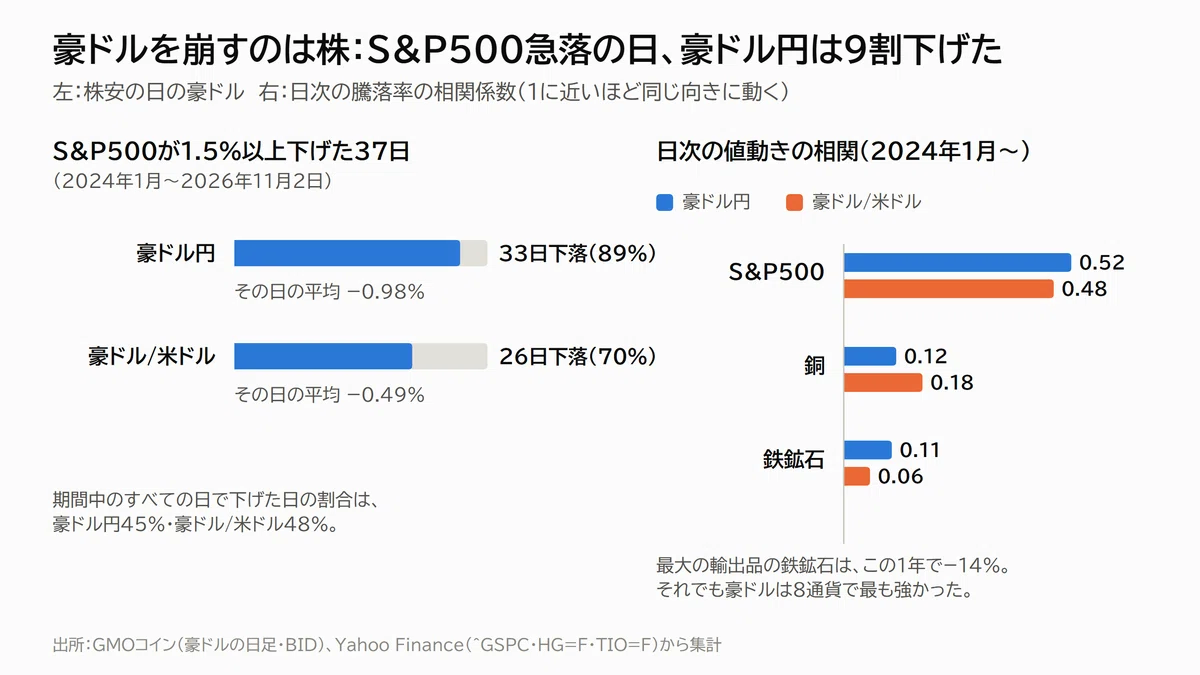
What affects AUD price movements the most is US stocks.
• There were 37 days from January 2024 when the S&P 500 fell by 1.5% or more in a single day. On those days, AUD/JPY fell on 33 days (89%) and AUD/USD fell on 26 days (70%) (averages of -0.98% and -0.49%). For all days during the period, the days it fell were 45% and 48%.
• The correlation of daily returns is 0.52 with the S&P 500 (AUD/JPY) and 0.48 (AUD/USD). With iron ore, the largest export, it is 0.11 and 0.06, which is almost unrelated. Over the past year, iron ore was -14%, but the AUD was the strongest of the 8 currencies.
• The years 2000 and 2008, when the AUD fell significantly after a ‘final rate hike,’ both coincided with sharp drops in stocks.
Immediate factors for stocks include anxiety over AI-related stocks (sharp drop in October), tensions in the Middle East, the results of the US midterm elections (vote counting from November 4, Japan time), US employment statistics (November 6), and US CPI (November 10). In determining the trend reversal of the AUD, the movement of US stocks may be as effective as the RBA’s next move.
7. Verifying 5 Classic Reversal Signs: Selling AUD/JPY Was Not Profitable
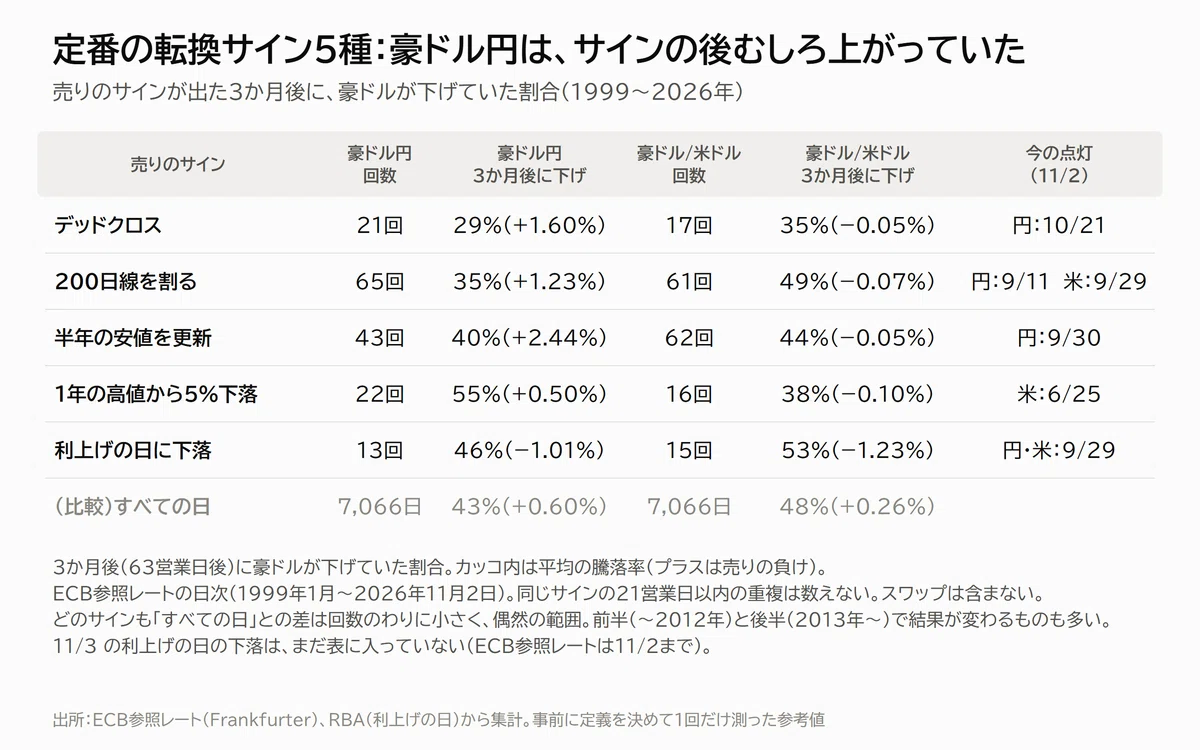
There are already three signs of a reversal for the Australian Dollar/Yen. So, what would have happened in the past if you had sold based on those signs? Using daily ECB reference rates from January 1999 to November 2, 2026, I defined the parameters before looking at the results and measured them once.
• Conditions: Assuming a sale at the reference rate on the day the sign appeared, count whether the Australian Dollar was lower three months later (63 business days). Instances of the same sign occurring within 21 business days are not counted. The benchmark for comparison is “all days.” Swaps are not included.
• Dead Cross: For the Australian Dollar/Yen, out of 21 instances, the price was lower three months later in 29% of cases (the average was +1.60%, meaning a loss on the short position). This was actually more likely to rise than on “all days” (where the decline rate was 43%). For the Australian Dollar/US Dollar, it was 35% (−0.05%).
• Breaking the 200-day moving average: Australian Dollar/Yen 35% (+1.23%), Australian Dollar/US Dollar 49% (−0.07%).
• Updating a six-month low: Australian Dollar/Yen 40% (+2.44%), Australian Dollar/US Dollar 44% (−0.05%).
• 5% drop from a one-year high: Australian Dollar/Yen 55% (+0.50%), Australian Dollar/US Dollar 38% (−0.10%).
• Decline on a rate hike day: Australian Dollar/Yen 46% (−1.01%), Australian Dollar/US Dollar 53% (−1.23%). This is the only case where selling resulted in a positive average, but the sample sizes are small (13 and 15 times), and for the Australian Dollar/Yen, the results are reversed between the first half (up to 2012) and the second half (2013 onwards). None of these signs show a difference from “all days” that is significant enough to be anything other than coincidence, given the number of occurrences. At the very least, the strategy of “selling because a sign appeared” has not been supported by the historical performance of the Australian Dollar. This verification does not explain why the Australian Dollar/Yen was actually more likely to rise after these signs.
Other factors where no advantage could be confirmed in historical data
• Riding the initial move immediately after an RBA announcement: Out of 17 decisions from September 2024 to September 2026, entering in the same direction 5 minutes after the announcement resulted in an average of +0.6 pips after 60 minutes, and a median of −2.1 pips the next day (aggregated using 10-second Australian Dollar/Yen data).
• Contrarian trading based on the volume of net short positions: As noted in Chapter 5, this has not served as a buy signal.
The cost of holding a short position
• The swap rates applied on November 3 were −118 yen per day for a short Australian Dollar/Yen position and −26 yen for a short Australian Dollar/US Dollar position (both for 10,000 currency units, GMO Coin). Holding a short Australian Dollar/Yen position for three months costs about 11,000 yen, which is approximately 1% of the notional principal (about 1.1 million yen). Long positions earn +88 yen and +6 yen, respectively.
• Even for the same Australian Dollar short position, the Australian Dollar/Yen pays about 4.5 times the swap cost of the Australian Dollar/US Dollar. A short position aimed at a reversal is structured such that even if you win on price movement, you are likely to be eroded by swap costs.
8. Price benchmarks as of November 3 (Record)
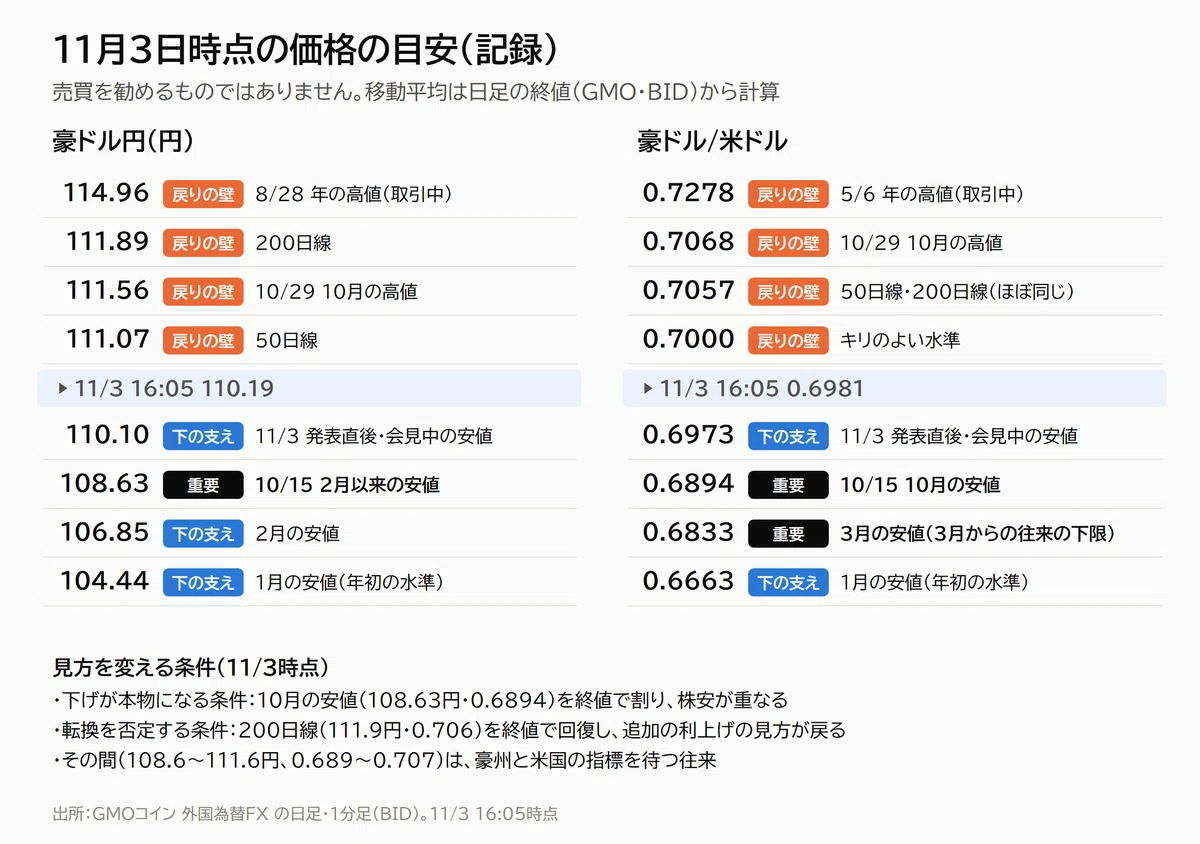
These are scenarios and price benchmarks organized from data as of November 3. This is for record-keeping purposes and does not constitute a recommendation to buy or sell (prices are GMO Coin BID).
Scenarios (as of November 3)
• 1. Downward break: A combination of a sharp drop in US stocks, weakness in Australian employment and inflation, and a stronger dollar leads to a closing price below the October lows (Australian Dollar/Yen 108.63 yen, Australian Dollar/US Dollar 0.6894). The next benchmarks are 106.85 yen for the Australian Dollar/Yen (February low) and 0.6833 for the Australian Dollar/US Dollar (the lower limit of the range since March).
• 2. Range-bound: Waiting for Australian and US indicators between 108.6–111.6 yen for the Australian Dollar/Yen and 0.689–0.707 for the Australian Dollar/US Dollar. Historically, after the “final rate hike,” the Australian Dollar/US Dollar often declined six months later, but highs were also frequently reached afterward.
• 3. Resumption of the uptrend: Inflation and wages remain strong, expectations for additional rate hikes return, and stocks stabilize. If the Australian Dollar/Yen closes above the 200-day moving average (111.89 yen) and the Australian Dollar/US Dollar closes above the October high (0.7068), the next benchmarks are the yearly highs (114.96 yen and 0.7278).
Summary of conditions (as of November 3)
• Conditions for a genuine decline: A closing price below the October lows combined with a drop in stocks. Past episodes where the Australian Dollar fell significantly (2000, 2008, March 2020) were all accompanied by sharp drops in stocks.
• Conditions that negate a reversal: Recovering the 200-day moving average (Australian Dollar/Yen 111.9 yen, Australian Dollar/US Dollar 0.706) on a closing basis and a return of expectations for additional rate hikes.
• Costs: Shorting the Australian Dollar/Yen costs −118 yen per day, and shorting the Australian Dollar/US Dollar costs −26 yen (per 10,000 units).
• Schedule (Japan Time): Nov 4, 9:00 AM: US midterm election vote counting; Nov 6, 10:30 PM: US employment statistics; Nov 7, 5:30 AM: CFTC position details (as of Nov 3); Nov 10, 10:30 PM: US CPI; Nov 17, 9:30 AM: RBA minutes; Nov 18, 9:30 AM: Australian wage index (July–Sept quarter); Nov 19, 9:30 AM: Australian employment statistics (October); Nov 25, 9:30 AM: Australian CPI (October); Dec 8, 12:30 PM: RBA decision.
Summary: 5 things seen in the numbers
• The November 3 rate hike was 6 to 3, and the phrasing regarding additional rate hikes has disappeared. This is the second consecutive time the Australian Dollar has fallen on a rate hike day, following September.
• The Australian Dollar/Yen has seen reversal signs such as a dead cross. However, for the past 27 years, selling on those signs has not been profitable; in fact, it has tended to rise more than the average.
• In the past seven “final rate hikes,” the Australian Dollar/US Dollar reached a high afterward in six cases. Six months later, it had fallen in five cases.
• The core of the record-high net short positions is “insurance” by asset managers, while hedge funds and others are net long. Short covering does not necessarily lead to a stronger Australian Dollar.
• What has caused the Australian Dollar to collapse significantly in the past has been sharp drops in stocks. If you want to gauge a reversal, you need to watch US stocks as much as the RBA.
Notes
• This article is for informational purposes only and does not recommend the purchase or sale of any specific financial product. Please make investment decisions at your own risk.
• Figures are based on data as of November 3, 2026, at 16:05 (Japan Time). Verification based on past data does not guarantee future results. This includes reference values with small sample sizes or conditions not registered in advance.
• Exchange rates use the public rates (BID) from GMO Coin Foreign Exchange FX, and long-term verification uses the ECB reference rate (one value per day). Levels may differ by a few pips depending on the provider and time.
• Statements from press conferences are translated from English news reports.
• Graphs and tables were created based on the data below.
Sources and Data
Data
• RBA: Cash Rate History https://www.rba.gov.au/statistics/cash-rate/
• RBA: Statement (November 3, 2026) https://www.rba.gov.au/media-releases/2026/mr-26-30.html
• RBA: Statement (September 29, 2026) https://www.rba.gov.au/media-releases/2026/mr-26-27.html
• RBA: Statement on Monetary Policy (November 2026) Economic Outlook https://www.rba.gov.au/publications/smp/2026/nov/outlook.html
• ABS: CPI (September 2026) https://www.abs.gov.au/statistics/economy/price-indexes-and-inflation/consumer-price-index-australia/latest-release
• ABS: Labour Force Statistics (September 2026) https://www.abs.gov.au/statistics/labour/employment-and-unemployment/labour-force-australia/latest-release
• ABS: Wage Price Index (April–June 2026 quarter) https://www.abs.gov.au/statistics/economy/price-indexes-and-inflation/wage-price-index-australia/latest-release
• CFTC: Commitments of Traders (Legacy format) https://publicreporting.cftc.gov/resource/6dca-aqww.json
• CFTC: Commitments of Traders (Disaggregated format) https://publicreporting.cftc.gov/resource/gpe5-46if.json
• ECB Reference Rate (Frankfurter) https://api.frankfurter.dev/v1/2026-11-02?base=AUD&symbols=USD,JPY
• GMO Coin Foreign Exchange FX: Public API (Daily/1-minute) https://forex-api.coin.z.com/public/v1/klines?symbol=AUD_JPY&priceType=BID&interval=1day&date=2026
• GMO Coin: Historical Swaps https://coin.z.com/jp/corp/product/info/fx/swap/
• Yahoo Finance (S&P 500 ^GSPC, Copper HG=F, Iron Ore TIO=F) https://finance.yahoo.com/quote/%5EGSPC/
News & Research
• ABC News (Live coverage of the November 3 decision and press conference) https://www.abc.net.au/news/2026-11-03/rba-interest-rates-markets-live-coverage/107338216
• SBS News (Live blog for November 3. Major bank forecasts) https://www.sbs.com.au/news/live-blog/rba-november-2026-interest-rates-decision-live/f6csn2n1w
• investingLive (Governor’s press conference on September 29) https://investinglive.com/central-banks/rba-governor-bullock-reaffirms-that-the-central-bank-will-raise-interest-rates-again-if-needed/
• Bloomberg (Asset manager AUD shorts, October 26) https://www.bloomberg.com/news/articles/2026-10-26/asset-manager-australian-dollar-shorts-hit-record-on-risk-off
• Hedge Fund Alpha (Introduction to AFR article: Sellers are not hedge funds) https://alpha-maven.com/story/hedge-fund/aussie-dollar-short-bets-hit-record-but-its-not-from-the-hedge-funds-afr
• COT Screener (Asset managers turn to record shorts on AUD and Peso) https://cotscreener.com/long-story-short/asset-managers-turn-against-aussie-kiwi-peso
• FXCM (RBA rate hike and change in rhetoric on November 7, 2023) https://www.fxcm.com/uk/insights/the-reserve-bank-of-australia-hiked-rates-to-the-highest-in-22-years-but-made-a-dovish-shift/