


The Indian Rupee (INR) is under pressure against the US Dollar (USD) on Thursday. The USD/INR pair rises to near 95.44 after a corrective move the previous day, even as the US Dollar and oil prices trade lower.
As of writing, the US Dollar Index (DXY), which gauges the Greenback’s value against six major currencies, trades 0.1% lower to near 99.89.
The US Dollar has come under pressure amid easing fears of a near-term Federal Reserve (Fed) interest rate hike after an expected slowdown in the United States (US) Consumer Price Index (CPI) growth in July.
USD repricing gathers pace as July CPI cools and Fed bets are trimmed
Analysts at Brown Brothers Harriman note that the latest US inflation data prompted a modest dovish shift in rate expectations, even as the Dollar’s broader rally persisted. They highlight that “Fed funds futures trimmed bets of a September rate hike to 35% from roughly 50% after the US July CPI print signaled inflation is cooling.” In line with consensus, “headline CPI rose +0.1% m/m vs. -0.4% in June and eased to 3.4% y/y vs. 3.5% in June,” while “core CPI rose +0.2% m/m vs. 0.0% in June and ease to 2.5% y/y vs. 2.6% in June.”
BBH stresses that, “importantly, inflation momentum eased in July,” with “the three-month annualized rate of core CPI, headline, and super core all plunged under the Fed’s 2% target.” Against this backdrop, the bank argues that “in our view, there is room for a further dovish repricing in Fed hike expectations against USD,” pointing out that “the US labor market is in balance, wage growth is consistent with the Fed’s 2% inflation target, and Fed policy is restrictive.”
Oil prices weaken
Oil prices faced sharp selling pressure as OPEC has revised its global oil demand growth forecast for the current year. On Wednesday, the oil cartel reported a lower oil demand growth projection at 580,000 barrels per day (bpd) from the previous forecast of 780,000 bpd.
At press time, the MCX Crude Oil contract expiring on August 19 trades 1.85% lower at around Rs. 7,785, tracking losses in global oil prices.
Contrary to the Indian Rupee’s current price action, currencies from economies such as India, which rely heavily on oil imports to meet their energy needs, tend to underperform in a high-oil-price environment.
The odds of a sharp recovery in oil prices remain high amid the absence of progress in US-Iran negotiations on the reopening of the Strait of Hormuz, a critical chokepoint for almost 20% of global energy supply, has staged a strong recovery in oil prices.
India’s retail CPI accelerates in July
Inflation in India at the retail level accelerated to 4.45% Year-on-Year (YoY) in July from 4.38% in June, almost in line with estimates of 4.50%. The retail CPI remains within the Reserve Bank of India’s (RBI) tolerance band of 2%-6%.
Technical Analysis: USD/INR wobbles near 20-day EMA
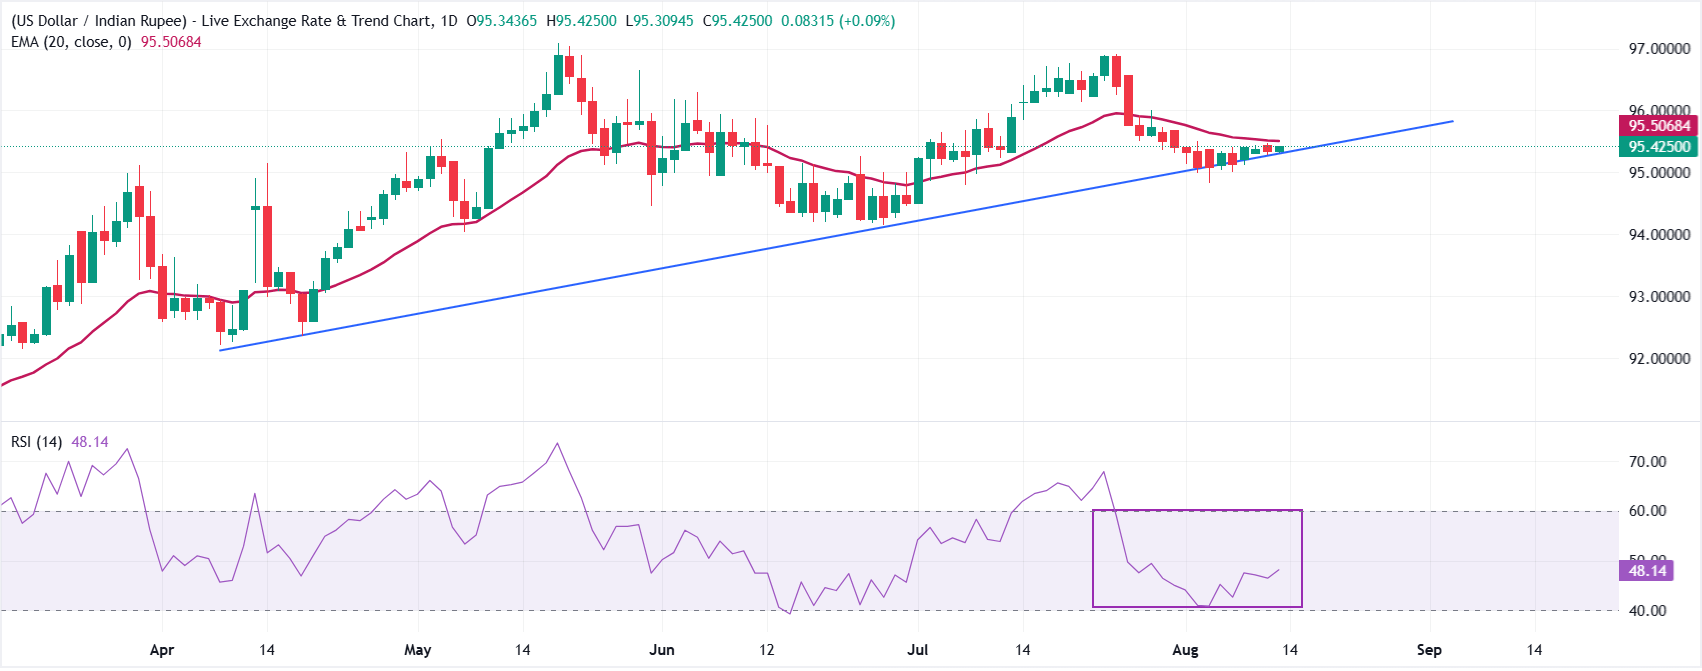
USD/INR trades at around 95.44, keeping a mild bearish near-term bias as it holds below the 20-period Exponential Moving Average (EMA) at 95.50. Price action remains under this short-term trend proxy, suggesting rallies are capped for now, while the Relative Strength Index (14) at 46.74 stays in neutral-to-soft territory, hinting at lacklustre bullish momentum rather than a decisive selloff.
On the downside, initial support is aligned with the former break point of the rising trend line at 95.30, which now acts as an underlying floor for the pair; below that, the August 5 low at 94.83 is the critical support level. On the topside, a recovery would first need to clear the 20-period EMA at 95.50 to ease bearish pressure, with a sustained move above this level required to shift the bias towards a more constructive stance. Looking up, the 96.00 level would be the next hurdle for the pair.
(The technical analysis of this story was written with the help of an AI tool. Know more.)
US Dollar FAQs
The US Dollar (USD) is the official currency of the United States of America, and the ‘de facto’ currency of a significant number of other countries where it is found in circulation alongside local notes. It is the most heavily traded currency in the world, accounting for over 88% of all global foreign exchange turnover, or an average of $6.6 trillion in transactions per day, according to data from 2022.
Following the second world war, the USD took over from the British Pound as the world’s reserve currency. For most of its history, the US Dollar was backed by Gold, until the Bretton Woods Agreement in 1971 when the Gold Standard went away.
The most important single factor impacting on the value of the US Dollar is monetary policy, which is shaped by the Federal Reserve (Fed). The Fed has two mandates: to achieve price stability (control inflation) and foster full employment. Its primary tool to achieve these two goals is by adjusting interest rates.
When prices are rising too quickly and inflation is above the Fed’s 2% target, the Fed will raise rates, which helps the USD value. When inflation falls below 2% or the Unemployment Rate is too high, the Fed may lower interest rates, which weighs on the Greenback.
In extreme situations, the Federal Reserve can also print more Dollars and enact quantitative easing (QE). QE is the process by which the Fed substantially increases the flow of credit in a stuck financial system.
It is a non-standard policy measure used when credit has dried up because banks will not lend to each other (out of the fear of counterparty default). It is a last resort when simply lowering interest rates is unlikely to achieve the necessary result. It was the Fed’s weapon of choice to combat the credit crunch that occurred during the Great Financial Crisis in 2008. It involves the Fed printing more Dollars and using them to buy US government bonds predominantly from financial institutions. QE usually leads to a weaker US Dollar.
Quantitative tightening (QT) is the reverse process whereby the Federal Reserve stops buying bonds from financial institutions and does not reinvest the principal from the bonds it holds maturing in new purchases. It is usually positive for the US Dollar.