


BearishBullish
Consensus forecast1.2030-2.63% vs spot
1–3 Months sentiment
Bearish
Bullish0%
Bearish100%
Sideways0%
A target within ±0.5% of spot is counted as sideways. Each provider contributes one vote; the consensus rate separately down-weights extreme outliers.
BearishBullish
Consensus forecast1.1763-4.79% vs spot
Mid 2027 sentiment
Bearish
Bullish0%
Bearish100%
Sideways0%
A target within ±0.5% of spot is counted as sideways. Each provider contributes one vote; the consensus rate separately down-weights extreme outliers.
BearishBullish
Consensus forecast1.1111-10.07% vs spot
2027 sentiment
Bearish
Bullish0%
Bearish100%
Sideways0%
A target within ±0.5% of spot is counted as sideways. Each provider contributes one vote; the consensus rate separately down-weights extreme outliers.
| Period | Consensus | Bullish | Bearish | Sideways | Bias | Providers |
|---|---|---|---|---|---|---|
| 1–3 MonthsQ4 2026 | 1.2030 | 0% | 100% | 0% | Bearish | 6 |
| Mid 2027Q2 2027 | 1.1763 | 0% | 100% | 0% | Bearish | 6 |
| 2027Q4 2027 | 1.1111 | 0% | 100% | 0% | Bearish | 3 |
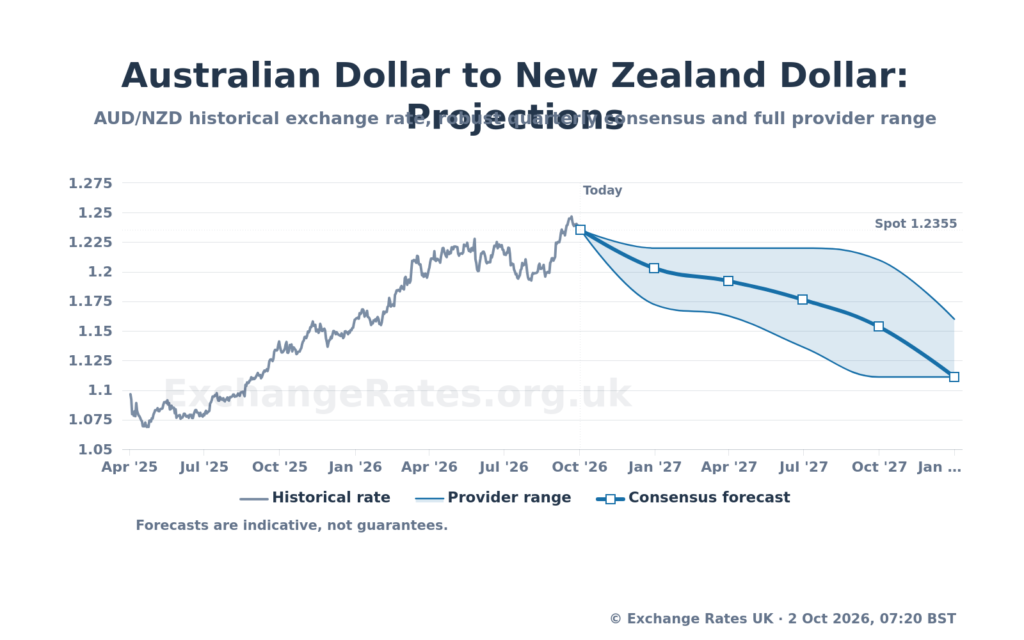
We forecast the Australian Dollar-to-New Zealand Dollar rate to reach 1.2030 by December 2026, 1.1922 by March 2027 and 1.1763 by June 2027. The table below lists the underlying quarterly checkpoints.
| Pair | Today | Q4 2026 | Q1 2027 | Q2 2027 | Q3 2027 | Q4 2027 |
|---|---|---|---|---|---|---|
| AUD/NZD | 1.2355 | 1.2030 | 1.1922 | 1.1763 | 1.1536 | 1.1111 |

Daily market history is followed by the robust quarterly consensus. The shaded area is the full provider low–high range.
Positive values indicate that one AUD is forecast to buy more NZD; negative values indicate a lower projected exchange rate.
Longer bars indicate greater disagreement between providers. The marker shows the robust consensus within each range.
The historical chart provides market context only. Moving averages are calculated from the daily rate series and are not forecasts.
View the forecast chart data
| Quarter | Consensus | Low | High | Move vs spot | Range width | Providers |
|---|---|---|---|---|---|---|
| Q4 2026 | 1.2030 | 1.1723 | 1.2200 | -2.63% | 3.97% | 6 |
| Q1 2027 | 1.1922 | 1.1628 | 1.2200 | -3.50% | 4.80% | 6 |
| Q2 2027 | 1.1763 | 1.1364 | 1.2200 | -4.79% | 7.11% | 6 |
| Q3 2027 | 1.1536 | 1.1111 | 1.2101 | -6.63% | 8.58% | 5 |
| Q4 2027 | 1.1111 | 1.1111 | 1.1600 | -10.07% | 4.40% | 3 |

Current Trend: Is AUD/NZD going up or down?
In the short term, the AUD to NZD exchange rate has been trending higher from a recent low of 1.1926 on 3rd August 2026 (≈ 3.6% higher).
AUD/NZD Technical Signals
As of 2nd October 2026, AUD/NZD is near its 8-day EMA, near its 21-day EMA, trading above its 50-day EMA by 0.63%, trading above its 100-day EMA by 1.29%.
Daily Forecast Table
| Date | Weekday | Indicative low | Indicative high | Rate | % change |
|---|---|---|---|---|---|
| 02/10 | Friday | 1.2231 | 1.2479 | 1.2355 | 0% |
| 03/10 | Saturday | 1.2228 | 1.2475 | 1.2351 | -0.03% |
| 04/10 | Sunday | 1.2224 | 1.2471 | 1.2348 | -0.06% |
| 05/10 | Monday | 1.2221 | 1.2468 | 1.2344 | -0.09% |
| 06/10 | Tuesday | 1.2217 | 1.2464 | 1.2341 | -0.12% |
| 07/10 | Wednesday | 1.2214 | 1.246 | 1.2337 | -0.15% |
| 08/10 | Thursday | 1.221 | 1.2457 | 1.2333 | -0.18% |
| 09/10 | Friday | 1.2206 | 1.2453 | 1.233 | -0.2% |
| 10/10 | Saturday | 1.2203 | 1.2449 | 1.2326 | -0.23% |
| 11/10 | Sunday | 1.2199 | 1.2446 | 1.2323 | -0.26% |
| 12/10 | Monday | 1.2196 | 1.2442 | 1.2319 | -0.29% |
| 13/10 | Tuesday | 1.2192 | 1.2438 | 1.2315 | -0.32% |
| 14/10 | Wednesday | 1.2189 | 1.2435 | 1.2312 | -0.35% |
| 15/10 | Thursday | 1.2185 | 1.2431 | 1.2308 | -0.38% |
| 16/10 | Friday | 1.2181 | 1.2428 | 1.2304 | -0.41% |
| 17/10 | Saturday | 1.2178 | 1.2424 | 1.2301 | -0.44% |
| 18/10 | Sunday | 1.2174 | 1.242 | 1.2297 | -0.47% |
| 19/10 | Monday | 1.2171 | 1.2417 | 1.2294 | -0.5% |
| 20/10 | Tuesday | 1.2167 | 1.2413 | 1.229 | -0.53% |
| 21/10 | Wednesday | 1.2164 | 1.2409 | 1.2286 | -0.56% |
| 22/10 | Thursday | 1.216 | 1.2406 | 1.2283 | -0.58% |
| 23/10 | Friday | 1.2156 | 1.2402 | 1.2279 | -0.61% |
| 24/10 | Saturday | 1.2153 | 1.2398 | 1.2276 | -0.64% |
| 25/10 | Sunday | 1.2149 | 1.2395 | 1.2272 | -0.67% |
| 26/10 | Monday | 1.2146 | 1.2391 | 1.2268 | -0.7% |
| 27/10 | Tuesday | 1.2142 | 1.2387 | 1.2265 | -0.73% |
| 28/10 | Wednesday | 1.2138 | 1.2384 | 1.2261 | -0.76% |
| 29/10 | Thursday | 1.2135 | 1.238 | 1.2257 | -0.79% |
| 30/10 | Friday | 1.2131 | 1.2376 | 1.2254 | -0.82% |
| 31/10 | Saturday | 1.2128 | 1.2373 | 1.225 | -0.85% |
| 01/11 | Sunday | 1.2124 | 1.2369 | 1.2247 | -0.88% |
Daily low/high figures are an indicative ±1% band around the interpolated consensus path, not separate bank targets.
Australian Dollar to New Zealand Dollar Forecast (Month-by-Month)
Monthly Forecast Table
| Month | Open | Min–max path | Close | % change |
|---|---|---|---|---|
| October 2026 | 1.2355 | 1.225–1.2355 | 1.225 | -0.85% |
| November 2026 | 1.2247 | 1.2142–1.2247 | 1.2142 | -1.72% |
| December 2026 | 1.2138 | 1.203–1.2138 | 1.203 | -2.63% |
| January 2027 | 1.2029 | 1.1993–1.2029 | 1.1993 | -2.93% |
| February 2027 | 1.1992 | 1.1959–1.1992 | 1.1959 | -3.2% |
| March 2027 | 1.1958 | 1.1922–1.1958 | 1.1922 | -3.5% |
| April 2027 | 1.192 | 1.187–1.192 | 1.187 | -3.93% |
| May 2027 | 1.1868 | 1.1815–1.1868 | 1.1815 | -4.37% |
| June 2027 | 1.1814 | 1.1763–1.1814 | 1.1763 | -4.79% |
| July 2027 | 1.1761 | 1.1687–1.1761 | 1.1687 | -5.41% |
| August 2027 | 1.1684 | 1.161–1.1684 | 1.161 | -6.03% |
| September 2027 | 1.1608 | 1.1536–1.1608 | 1.1536 | -6.63% |
| October 2027 | 1.1531 | 1.1393–1.1531 | 1.1393 | -7.79% |
| November 2027 | 1.1388 | 1.1254–1.1388 | 1.1254 | -8.91% |
| December 2027 | 1.125 | 1.1111–1.125 | 1.1111 | -10.07% |