- The Pound Sterling hit five-week lows against the US Dollar, then rebounded.
- GBP/USD stands tall amid US-China trade war escalation, awaiting UK CPI data.
- Technical analysis points to more upside for the pair as the daily RSI turns bullish.
The Pound Sterling (GBP) jumped back into the game against the US Dollar (USD), allowing the GBP/USD pair to stage a solid comeback from five-week troughs.
Pound Sterling found buyers near the 1.2700 region
In doing so, GBP/USD recorded over 1.5% gain over the week, rejoicing in the USD’s demise across the board. Markets smashed US assets such as Wall Street stocks, the Greenback and US government bonds on increased economic and financial stability concerns under US President Donald Trump’s administration.
The pair extended the previous week’s slide at the start of the week on Monday and hit a monthly low at 1.2708 as traders weighed the risks of an intensifying global trade war, led by President Trump. Last Friday, China announced an additional 34% retaliatory tariff on all goods imported from the US, following Trump’s reciprocal tariff move on Liberation Day, April 2.
In response, the White House confirmed late Tuesday that 104% duties on imports from China would take effect after midnight on Wednesday. The tit-for-tat tariff game extended as Beijing hit back at Trump’s 104% tariffs with its own additional tariffs of 84%, up from the previous 34%, on all American goods.
Later that day, US President Donald Trump announced a 90-day ‘pause’ on reciprocal tariffs of 10% for all countries except China. Trump raised the tariff rate for China to 125%, effective immediately. The US-China trade rift got even bigger, with Beijing preparing to deepen the China-EU trade, indirectly aiming at American companies, per the Wall Street Journal (WSJ).
Trump’s 90-day breather on the reciprocal tariffs triggered the much-awaited risk rally and led Wall Street indices to record their best day in over a decade. The sharp turnaround in risk sentiment amid deepening US-Sino trade war-led US economic concerns knocked the US Dollar down to its lowest level in nearly two years against its major currency rivals.
Markets continued pricing in three to four interest rate cuts by the US Federal Reserve (Fed) amid increased risks of economic recession and easing inflation, exacerbating the pain in the buck. The US March Consumer Price Index (CPI) inflation came in tamer-than-expected on Thursday, although it did not show the full impact of the trade war. The US CPI rose 0.1% in March, putting the 12-month inflation rate at 2.4%, down from 2.8% in February.
Expectations of divergence between the Fed and Bank of England (BoE) monetary policy outlooks further helped the GBP/USD recovery.
Heading into the weekend, the US Dollar extended its downbeat momentum, undermined by renewed concerns over the Fed’s independence, which could lead to financial instability.
US Supreme Court Chief Justice John Roberts reversed a court ruling, temporarily allowing US President Donald Trump’s Administration to fire members of independent agencies. Markets speculated that Trump could take this opportunity to fire Fed Chair Jerome Powell, raising concerns over the financial stability in the world’s largest economy.
Data published by the Office for National Statistics (ONS) showed on Friday that the British economy expanded by 0.5% in February after recording no growth in January. The market forecast was for a 0.1% growth in the reported period. Stronger-than-expected UK growth numbers helped the Pound Sterling preserve its recovery momentum.
Week ahead: UK data and tariffs in focus
After a tumultuous week of back and forth on Trump’s ‘reciprocal tariffs’ and the resultant volatility, traders gear up for more action in the week leading to Holy Friday.
Monday is quiet in terms of high-impact economic data from both the United Kingdom (UK) and the United States (US). Tuesday will feature the UK employment data.
The Chinese first-quarter (Q1) Gross Domestic Product (GDP) will be released on Wednesday alongside the Retail Sales and Industrial Production. Amidst big banks’ revising their China growth forecasts lower, the data could trigger a significant market reaction, impacting risk sentiment and higher-beta currencies such as the Pound Sterling.
Later that day, the UK CPI and US Retail Sales data will also grab attention. On Thursday, only the US weekly Jobless Claims data will be highly relevant.
On Friday, most of the world markets will remain closed because of Good Friday.
During the week, tariff talks will be under intense scrutiny as the US-China trade war deepens. Additionally, speeches from several Fed policymakers will also be closely followed for fresh hints on the Fed’s interest rate move in May.
GBP/USD: Technical Outlook
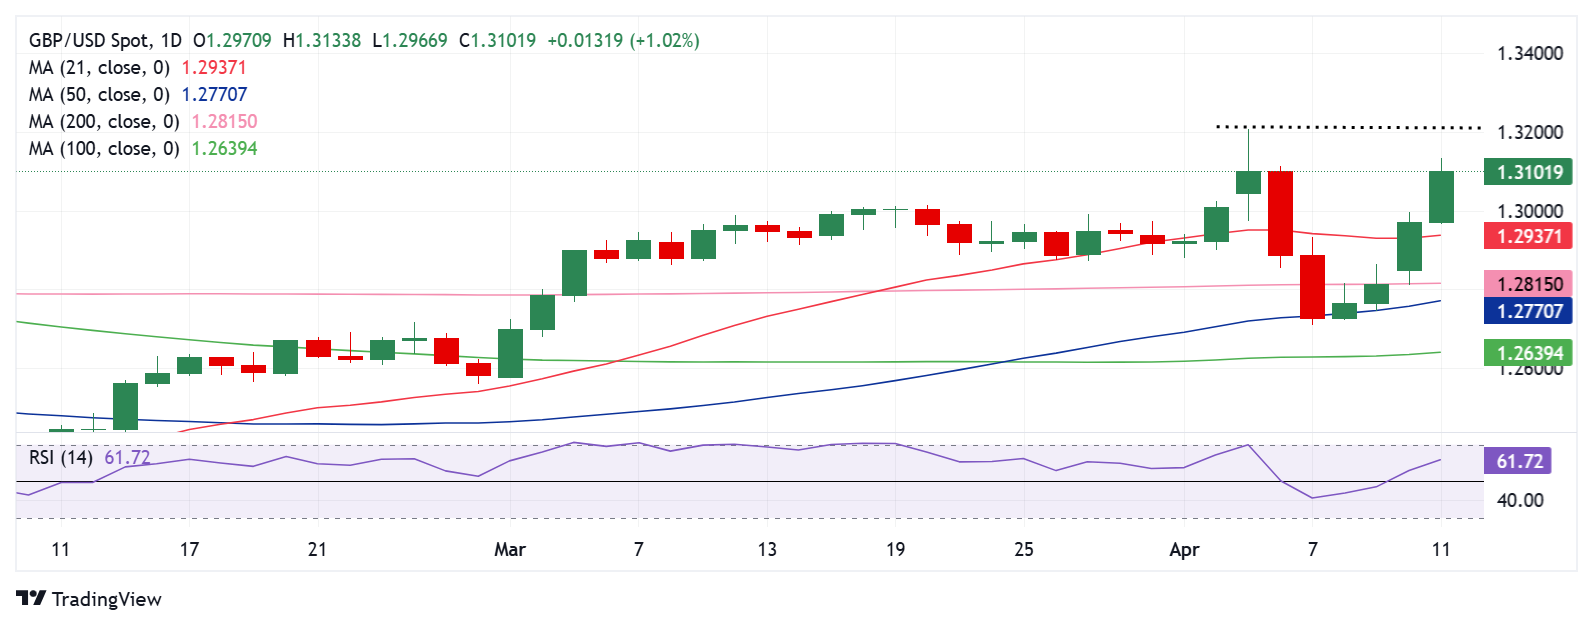
The short-term technical outlook for GBP/USD appears in favor of buyers as the 14-day Relative Strength Index (RSI) regained the midline, currently near 61.
Further, the pair has reclaimed its position above all major daily Simple Moving Averages (SMA), adding credence to the bullish potential.
The pair must close the week above the 1.3100 barrier to resume its journey toward the half-yearly high of 1.3207.
The next upside target for buyers is aligned at the 1.3300 threshold.
On a failure to resist at higher levels, sellers could fight back control, with the immediate support seen at the 21-day Simple Moving Average (SMA) at 1.2932.
Additional declines will likely challenge the 200-day SMA at 1.2815, below which the 50-day SMA at 1.2768 will be scrutinized.
A sustained move below that support level will expose the downside toward the 100-day SMA at 1.2638.
British Pound PRICE This week
The table below shows the percentage change of British Pound (GBP) against listed major currencies this week. British Pound was the strongest against the US Dollar.
| USD | EUR | GBP | JPY | CAD | AUD | NZD | CHF | |
|---|---|---|---|---|---|---|---|---|
| USD | -3.93% | -1.71% | -2.26% | -2.64% | -3.03% | -4.09% | -4.57% | |
| EUR | 3.93% | 2.60% | 2.37% | 1.98% | 0.88% | 0.46% | -0.07% | |
| GBP | 1.71% | -2.60% | -1.49% | -0.61% | -1.68% | -2.10% | -2.60% | |
| JPY | 2.26% | -2.37% | 1.49% | -0.35% | 0.17% | -0.64% | -2.04% | |
| CAD | 2.64% | -1.98% | 0.61% | 0.35% | -0.75% | -1.49% | -2.26% | |
| AUD | 3.03% | -0.88% | 1.68% | -0.17% | 0.75% | -0.42% | -0.90% | |
| NZD | 4.09% | -0.46% | 2.10% | 0.64% | 1.49% | 0.42% | -0.51% | |
| CHF | 4.57% | 0.07% | 2.60% | 2.04% | 2.26% | 0.90% | 0.51% |
The heat map shows percentage changes of major currencies against each other. The base currency is picked from the left column, while the quote currency is picked from the top row. For example, if you pick the British Pound from the left column and move along the horizontal line to the US Dollar, the percentage change displayed in the box will represent GBP (base)/USD (quote).