- GBP/USD trades slightly below 1.3400 in the European session on Wednesday.
- Annual CPI inflation in the UK rose to 3.6% in June.
- The near-term technical outlook points to oversold conditions for the pair.
Following a short-lasting recovery attempt in the early European session on Wednesday, GBP/USD struggles to hold its ground and trades below 1.3400. The near-term technical picture highlights oversold conditions for the pair.
British Pound PRICE This week
The table below shows the percentage change of British Pound (GBP) against listed major currencies this week. British Pound was the weakest against the US Dollar.
| USD | EUR | GBP | JPY | CAD | AUD | NZD | CHF | |
|---|---|---|---|---|---|---|---|---|
| USD | 0.41% | 0.76% | 1.07% | 0.16% | 0.68% | 1.01% | 0.47% | |
| EUR | -0.41% | 0.32% | 0.66% | -0.26% | 0.25% | 0.59% | 0.05% | |
| GBP | -0.76% | -0.32% | 0.24% | -0.59% | -0.07% | 0.26% | -0.13% | |
| JPY | -1.07% | -0.66% | -0.24% | -0.77% | -0.38% | 0.01% | -0.52% | |
| CAD | -0.16% | 0.26% | 0.59% | 0.77% | 0.51% | 0.86% | 0.32% | |
| AUD | -0.68% | -0.25% | 0.07% | 0.38% | -0.51% | 0.31% | -0.20% | |
| NZD | -1.01% | -0.59% | -0.26% | -0.01% | -0.86% | -0.31% | -0.53% | |
| CHF | -0.47% | -0.05% | 0.13% | 0.52% | -0.32% | 0.20% | 0.53% |
The heat map shows percentage changes of major currencies against each other. The base currency is picked from the left column, while the quote currency is picked from the top row. For example, if you pick the British Pound from the left column and move along the horizontal line to the US Dollar, the percentage change displayed in the box will represent GBP (base)/USD (quote).
The data published by the UK’s Office for National Statistics (ONS) showed earlier in the day that the annual inflation in the UK, as measured by the change in the Consumer Price Index (CPI), climbed to 3.6% in June from 3.4% in May. This reading came in above the market expectation of 3.4%. In the same period, the core CPI, which excludes volatile food and energy prices, rose 3.7%, compared to the 3.5% increase recorded previously. With the immediate reaction, GBP/USD edged higher but failed to gather momentum.
The risk-averse market environment and the broad-based US Dollar (USD) strength following the June inflation readings from the US make it difficult for GBP/USD to attract buyers on Wednesday.
After the Bureau of Labor Statistics reported on Tuesday that the Consumer Price Index (CPI) rose by 2.7% on a yearly basis in June, up from 2.4% in May, the probability of the Federal Reserve (Fed) lowering the policy rate by 25 basis points in September declined toward 50% from nearly 70% in the previous week, as per CME FedWatch Tool.
In the second half of the day, June Producer Price Index and Industrial Production data will be featured in the US economic calendar. Additionally, several Fed policymakers will be delivering speeches. Meanwhile, US stock index futures trade marginally lower on the day after losing about 0.5% earlier in the European session. In case Wall Street’s main indexes gain traction after the opening bell and reflect an improving risk mood, the USD could lose its strength and allow GBP/USD to limit its losses.
GBP/USD Technical Analysis
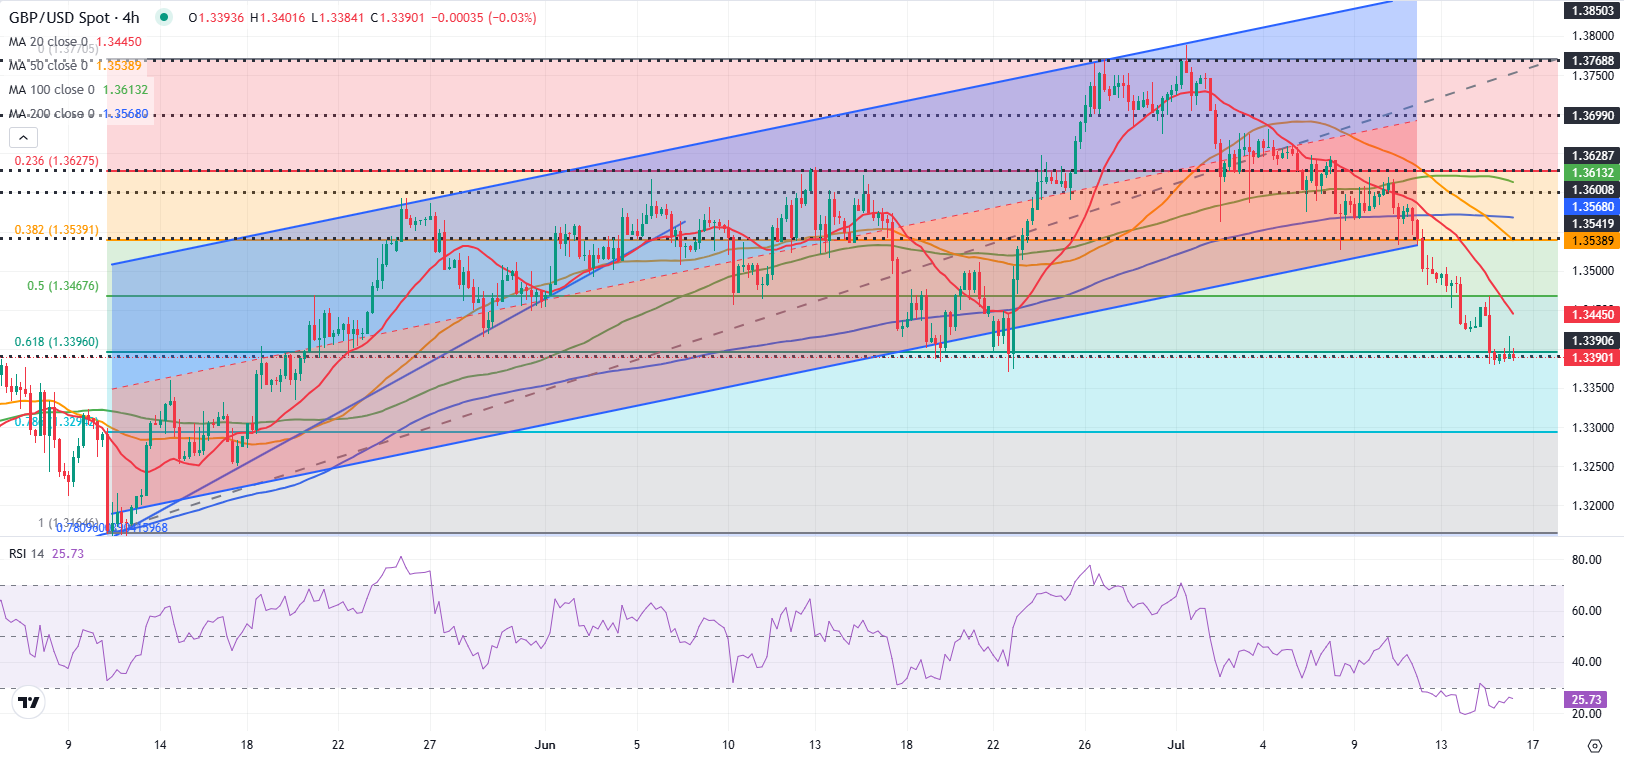
The Relative Strength Index (RSI) indicator on the 4-hour chart stays below 30, pointing to oversold conditions for the pair.
In case the pair rises above 1.3400 (Fibonacci 61.8% retracement of the latest uptrend) and stabilizes there, the technical correction could extend toward 1.3440 (20-period Simple Moving Average) and 1.3470 (Fibonacci 50% retracement).
If 1.3400 is confirmed as resistance, investors could ignore oversold conditions in the near term. In this scenario, 1.3300 (Fibonacci 78.6% retracement) and 1.3270 (100-day Simple Moving Average) could be seen as next support levels.
Pound Sterling FAQs
The Pound Sterling (GBP) is the oldest currency in the world (886 AD) and the official currency of the United Kingdom. It is the fourth most traded unit for foreign exchange (FX) in the world, accounting for 12% of all transactions, averaging $630 billion a day, according to 2022 data.
Its key trading pairs are GBP/USD, also known as ‘Cable’, which accounts for 11% of FX, GBP/JPY, or the ‘Dragon’ as it is known by traders (3%), and EUR/GBP (2%). The Pound Sterling is issued by the Bank of England (BoE).
The single most important factor influencing the value of the Pound Sterling is monetary policy decided by the Bank of England. The BoE bases its decisions on whether it has achieved its primary goal of “price stability” – a steady inflation rate of around 2%. Its primary tool for achieving this is the adjustment of interest rates.
When inflation is too high, the BoE will try to rein it in by raising interest rates, making it more expensive for people and businesses to access credit. This is generally positive for GBP, as higher interest rates make the UK a more attractive place for global investors to park their money.
When inflation falls too low it is a sign economic growth is slowing. In this scenario, the BoE will consider lowering interest rates to cheapen credit so businesses will borrow more to invest in growth-generating projects.
Data releases gauge the health of the economy and can impact the value of the Pound Sterling. Indicators such as GDP, Manufacturing and Services PMIs, and employment can all influence the direction of the GBP.
A strong economy is good for Sterling. Not only does it attract more foreign investment but it may encourage the BoE to put up interest rates, which will directly strengthen GBP. Otherwise, if economic data is weak, the Pound Sterling is likely to fall.
Another significant data release for the Pound Sterling is the Trade Balance. This indicator measures the difference between what a country earns from its exports and what it spends on imports over a given period.
If a country produces highly sought-after exports, its currency will benefit purely from the extra demand created from foreign buyers seeking to purchase these goods. Therefore, a positive net Trade Balance strengthens a currency and vice versa for a negative balance.