- The Pound Sterling hit two-month lows below 1.3200 against the US Dollar.
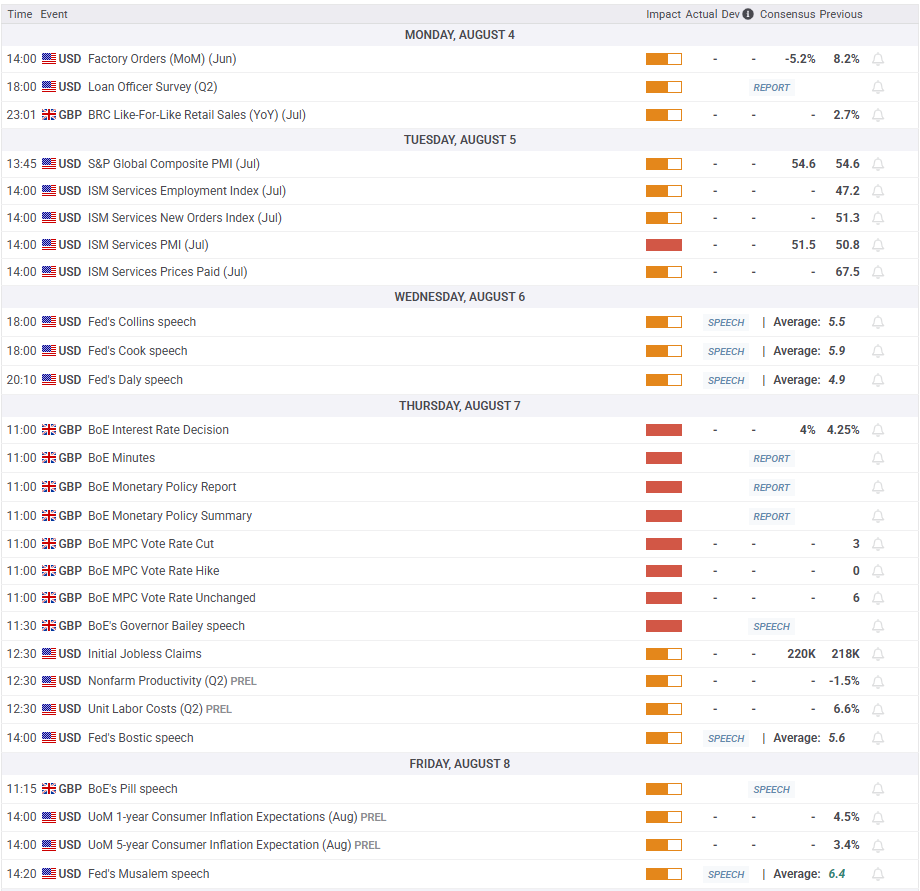
- GBP/USD buyers look forward to the BoE policy announcements for some respite.
- The daily technical setup shows a strengthening bearish bias for the GBP/USD pair.
The Pound Sterling (GBP) resumed its downside against the US Dollar (USD), smashing GBP/USD to the lowest level in two months below 1.3200. Although the pair recovered sharply on Friday, it ended the week in negative territory.
Pound Sterling faced headwinds from unabated USD demand
Snapping the previous week’s downtrend, the USD embarked on an impressive recovery rally against its major currency rivals as some major fundamental factors turned in its favor.
The US Dollar Index (DXY) hit its highest level in two months and reclaimed the 100.00 mark, recording the best week in almost three years.
The unabated demand for the Greenback triggered a fresh leg down in the GBP/USD pair in the past week.
At the start of the week, the USD capitalized on the revival of fears surrounding global trade as the August 1 deadline approached and the optimism surrounding the weekend’s trade agreement between the United States (US) and the European Union (EU) faded.
The USD cheered EUR/USD’s intense sell-off on the market’s realization that terms of the trade deal between the US and the EU favored the former and hardly lifted the economic outlook of the bloc, per Reuters.
France and Germany were quick to condemn the trade deal with the US, citing that the bloc had caved in to US President Donald Trump’s demand with an unbalanced deal that imposed a blanket 15% tariff on EU goods.
Further, renewed tensions over the extension of the US-China trade truce and the hawkish hold decision by the US Federal Reserve (Fed) on Wednesday acted as a tailwind to the Greenback’s upswing.
Xinhua News Agency, a Chinese state media outlet, carried a story early Thursday stating that “some deep-seated and structural problems in China-US economic and trade relations cannot be solved overnight.”
The commentary raised concerns over the potential extension of the August 12 tariff deadline by the US on China.
Meanwhile, the Fed policymakers voted 9-2 to keep the federal funds rate in a range between 4.25%-4.5%, with the accompanying statement underscoring ‘elevated uncertainty’ in the economy due to US President Donald Trump’s tariffs.
Fed Chair Jerome Powell stuck to the central bank’s cautious stance even though two Fed governors dissented at the July meeting, favoring a 25 basis points (bps) interest rate cut.
In the latter part of the week, US President Donald Trump announced fresh tariffs and boosted haven demand for the US Dollar, smashing the currency pair deeper into losses.
Late Thursday, Trump announced minimum global tariff rates at 10%, while increasing levies on Canadian goods to 35% from 25% for all products not covered by the US-Mexico-Canada trade agreement.
The president also slapped a 39% tariff rate on imports from Switzerland. However, he gave Mexico a 90-day reprieve from higher tariffs to negotiate a broader trade deal.
Renewed concerns over a potential tariff war between the US and Canada sapped risk appetite, weighing on high-beta currencies such as the Pound Sterling.
In the American session on Friday, GBP/USD reversed its direction and climbed toward 1.3300 as the USD came under strong selling pressure following the dismal employment data for July. The US Bureau of Labor Statistics (BLS) reported that Nonfarm Payrolls (NFP) rose by 73,000 in July. This reading came in below the market expectation of 110,000. Moreover, the BLS noted that the May NFP increase was revised down by 125,000 and the change for June was revised down by 133,000.
GBP/USD: Technical Outlook
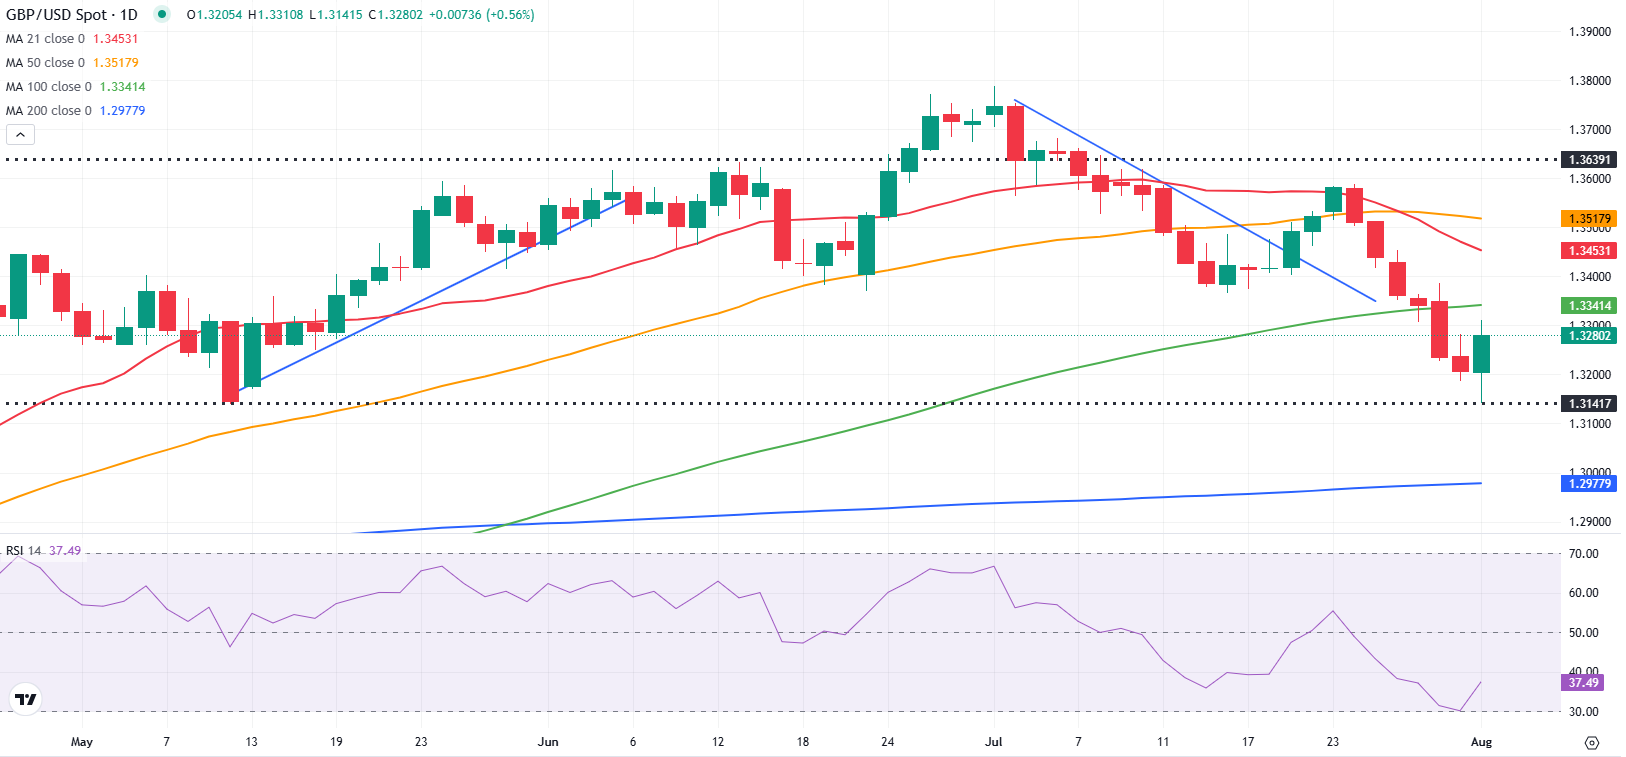
The previous week’s break above the falling trendline faced rejection at the 21-day Simple Moving Average (SMA), fuelling a fresh downtrend for the GBP/USD pair.
At the time of writing, the 14-day Relative Strength Index (RSI) stays below 40, suggesting that the pair’s latest rebound was a technical correction.
That said, any recovery attempts will need to clear the 100-day SMA at 1.3341 to negate the bearish bias.
The next critical resistance is placed at 1.3445, where the 21-day SMA coincides with the April 29 high.
Once that zone is cleared, buyers will target the 50-day SMA at 1.3516 en route to the 1.3600 threshold.
However, with a Bear Cross in play, sellers are expected to keep the upper hand in the upcoming week.
The 21-day SMA closed below the 50-day SMA last Monday, validating the Bear Cross.
Therefore, if the selling momentum intensifies, strong support at 1.3140, the May 12 and August 1 low, will be tested again.
A breach of the latter will expose the 1.3100 round level, followed by the April 14 low of 1.3063.