



For the GBP/JPY on Monday, October 5, I will organize the scenario based on the charts from the weekend.
Since it is crossing over the weekend, if any new fundamental news emerges during Saturday and Sunday, the price could jump sharply up or down at the start of the week.
My current impression is,
“I don’t want to touch it…”
The short-term trend is bullish. However, looking at the higher timeframes, the direction remains unclear as always.
Still, compared to the situation at the start of the morning we looked at in the Friday review, there is a slight sign of an upward trend this time.
Nevertheless, just because the trend is bullish, it doesn’t mean I want to buy right now…
Considering the location, timing, and stop-loss placement, my current view is that this is not a situation where I want to enter aggressively.
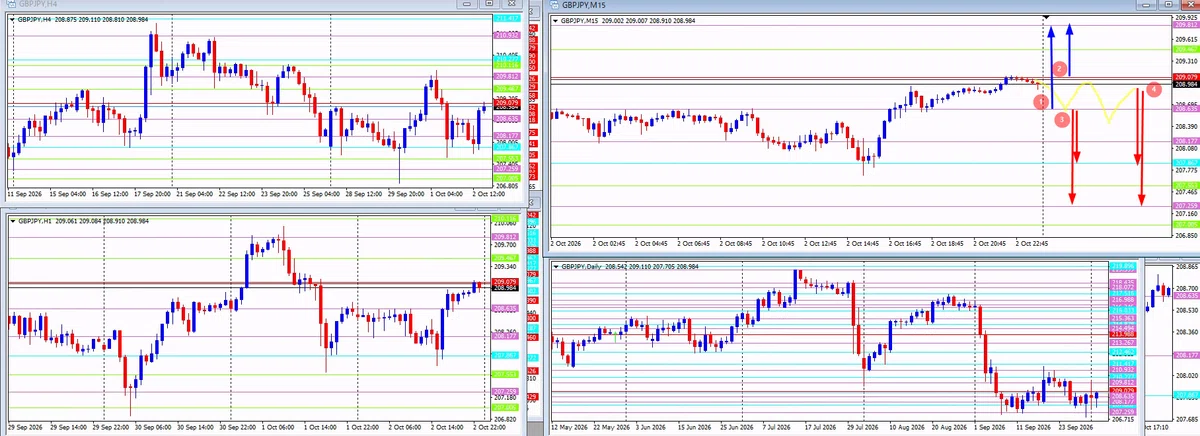
This is a chart with the 4-hour, 1-hour, 15-minute, and daily timeframes lined up. I have marked the scenarios (1) to (4) I am considering on the 15-minute chart in the top right.
A scenario is “preparation for how to respond if it moves like this.” It is not a prediction.
If it drops, I will watch how it falls and how it reacts. If it rises, I will see if a pattern emerges that allows me to consider buying.
If the conditions are not met, I will pass, and if the premise changes due to the price action at the start of the week, I will revise the scenario.
1) If it drops to the purple line | Observe how it falls and reacts, then consider whether to buy
Since the short-term trend is bullish, if it drops to around the 208.635 purple line, I will consider buying.
However, I am not thinking of buying immediately just because it reached the purple line.
There is a possibility that it will break straight through to the downside.
I will watch how it drops from the current position to the purple line on the 15-minute chart. After it reaches it, I will observe it for a few candles and decide whether to buy based on how it falls and reacts.
Stop-loss candidates and profit-taking candidates
However, the stop-loss position is quite awkward. If it’s awkward, it’s easy to get taken to the maximum stop-loss if the price moves against you, which is one of the reasons I’m not keen on it.
Aiming for 209.812 is only if it rises smoothly.
There is enough price range even up to the green line on the way, so if it gets stopped there and shows suspicious movement, I will consider taking profit.
I don’t intend to hold until the maximum candidate no matter what; I will respond while watching the actual price movement.
② If it rises from the current position | I will consider it if a 15-minute chart higher-low double bottom appears
Even if it rises directly from the current position, as far as I can see from the higher timeframe charts, I don’t want to buy aggressively.
The red line where we are now is a place that could become the starting point for a decline.
Furthermore, even looking at the higher timeframes, there is no atmosphere suggesting strong upward pressure. The direction is also unclear.
Therefore,
“I might reluctantly buy if a 15-minute chart higher-low double bottom appears”
is how I feel.
WB stands for double bottom. I don’t want to chase it just because it rose; I want to consider it after confirming such a pattern.
Stop-loss candidates and profit-taking candidates
Similar to ①, the stop-loss position is not very good.
In both ① and ②, I see it as a situation where it is easy to hit the maximum stop-loss if it moves against you. Even if the short-term outlook is bullish, I am not very enthusiastic given this positional relationship.
If it gets stuck at the upper green line on the way and shows suspicious movement, I will take profit quickly.
After that, it seems like a situation where there is no need to force yourself to take it all the way in one go, such as by looking for another timing to re-enter near the green line.
3. If it breaks below 208.635 | Do not sell immediately, watch for a few candles near the purple line
This is the case where it breaks below the 208.635 purple line.
If it moves with momentum at the start of the week, it could potentially drop sharply to the 208.177 purple line, or even the light blue line below that.
However, the current situation is not necessarily a clear selling trend.
Therefore,
I do not want to just say, “It broke below! Sell!”
After it breaks below, I want to see how it moves with the purple line as the upper limit. Just like in scenario 1, I want to watch a few 15-minute candles before considering whether to sell.
Stop-loss and take-profit candidates
Scenario 3 is also half-hearted when you include the stop-loss position.
Since there is enough profit margin even just to the light blue line below, whether or not to aim for the purple line beyond that depends on the price action at that time.
4. If it makes a lower low and then pulls back | Currently, the selling pattern I most want to wait for
At the moment, this is the pattern I would be most happy with.
In a pattern similar to the yellow line in the image, it makes a lower low once, and then pulls back.
If that happens,
the sentiment is, “I really want to sell here.”
By making a lower low, I confirm the downward trend, and then I wait for a pullback to sell.
Compared to ① through ③, this one feels easier to target.
Isn’t this a buying zone? Some of you might have thought that.In the short term, yes.
However, at the same time, if the red line is solidified, it could become a starting point for a decline.
Stop-loss candidates and take-profit candidates
-
Stop-loss candidate: Just before the green line above the red line
-
Maximum take-profit candidate: Same as ③, near the lower light blue to purple line
For this as well, I will wait to see if it actually takes that shape.
I have not decided at this moment that it will become ④.
Short-term direction is bullish. But what I want to wait for most is ④
My current summary for Monday is that the short-term outlook is bullish.
However, buying at ① and ② is quite half-baked when you include the stop-loss position.
For selling at ③, I don’t want to enter just because it broke below.
For now, what I want to wait for most is ④.
Looking at the direction and thinking about whether you actually want to enter are different things.
Even if the short-term trend is bullish, when you consider the location, stop-loss, and higher time frames,
“I don’t want to touch it right away…”
is my current impression.
How will the price move at the start of the week? First, I will make decisions while watching to see if it approaches the conditions for ① through ④.
On how to build a scenario
Like this time, confirm the current location from the higher time frame, and think about entry conditions and stop-loss/take-profit candidates in advance.
I have summarized the chart environment I actually use, the design of important lines, and how to build trade scenarios in detail in this article.
If you found this article helpful or interesting, I would be happy if you could press the Like button to support me.
Your reactions are what encourage me to continue creating articles in the future.
See you next time.
Participating in rankings
I am participating in rankings. Click to support ↓
Nihon Blog Mura | Popular Blog Ranking | FC2 Blog Ranking
Create a trading environment using MetaTrader (MT) [PR]
I usually use MetaTrader 4 (MT4) for chart analysis to compare multiple time frames and understand the market environment.
Overseas FX | AXIORY I use this myself. Supports MT4/MT5.
Domestic FX | JFX Hirose Tsusho Group. Chart analysis is possible with MT5.