

The Indian Rupee (INR) trades flat at around 95.40 against the US Dollar (USD) on Friday. The USD/INR pair consolidates as investors seek fresh cues regarding the reopening of the Strait of Hormuz, a vital passage to almost one-fifth of global energy supply, which is keeping oil prices higher.
At press time, the MCX Crude Oil contract expiring on August 19 trades 0.25% lower at around Rs. 7,800. Oil prices faced slight selling pressure in the past two days after posting a fresh weekly high at Rs. 8,075 on Tuesday. However, the restricted energy supply due to the closure of the Strait of Hormuz and the Bab al-Mandab Strait, which together account for almost 27% of global energy supply, could result in a resumption of the oil price rally.
Oil momentum cools, but TD Securities still sees upside ahead
According to TD Securities, the recent loss of steam in the rally has seen “easing near-term momentum” and has “also catalyzed modest selling in WTI crude on the day.” However, the bank’s commodity strategists “continue to highlight that fundamental tightness across crude and product markets should ultimately support further upside,” suggesting that the latest bout of selling is viewed as a temporary setback within an otherwise constructive medium-term outlook for oil prices.
Meanwhile, analysts have warned that higher oil prices could be a drag on India’s economic growth and the government’s investment expenditure, and boost inflation in the near term.
India fuel-price cuts seen unlikely as losses mount and geopolitical risks persist
Analysts at Standard Chartered have removed their earlier assumption of a retail fuel price cut in FY27, arguing that “lingering geopolitical uncertainty is likely to push inflation higher” and complicate the policy backdrop. The bank notes that “geopolitical uncertainty, crude oil price volatility and rising losses for public-sector oil companies and the government” have led it to drop the projected “INR 2.5 per liter reduction in retail fuel prices from September 2026.”
According to Standard Chartered, “losses were already around 0.3% of GDP in Q1-FY27, according to the oil minister, and could reach 0.4-0.5% by H1-FY27 if crude stays at USD 85-90/bbl, especially with the INR 10/liter excise-duty cut still in place.” In this context, the bank concludes that “with geopolitical tensions lingering and oil companies still reporting losses on retail fuel sales (including cooking gas), fuel-price cuts look unlikely in FY27 (see India – How the energy supply shock was managed).”
US Dollar is down as traders scale back hawkish Fed bets
The US Dollar trades lower in the European session, with fears of a Federal Reserve (Fed) interest rate hike receding, supporting a bearish near-term bias. At press time, the US Dollar Index, which gauges the Greenback’s value against six major currencies, is down 0.25% to near 99.70.
The CME FedWatch tool shows that the odds of the Fed holding policy rates steady in September have increased to almost 65%. This is a sharp turnaround from a 75% chance favoring the Fed to deliver two interest rate hikes by the end of the September policy meeting, recorded a month ago.
India’s producer inflation rises moderately in July
The Office of the Economic Adviser of India has reported that inflation at the wholesale level grew at a moderate pace of 9.78% in July against 10.25% estimates and the prior release of 9.87%.
Technical Analysis: USD/INR trades close to 20-day EMA, upward-sloping trendline
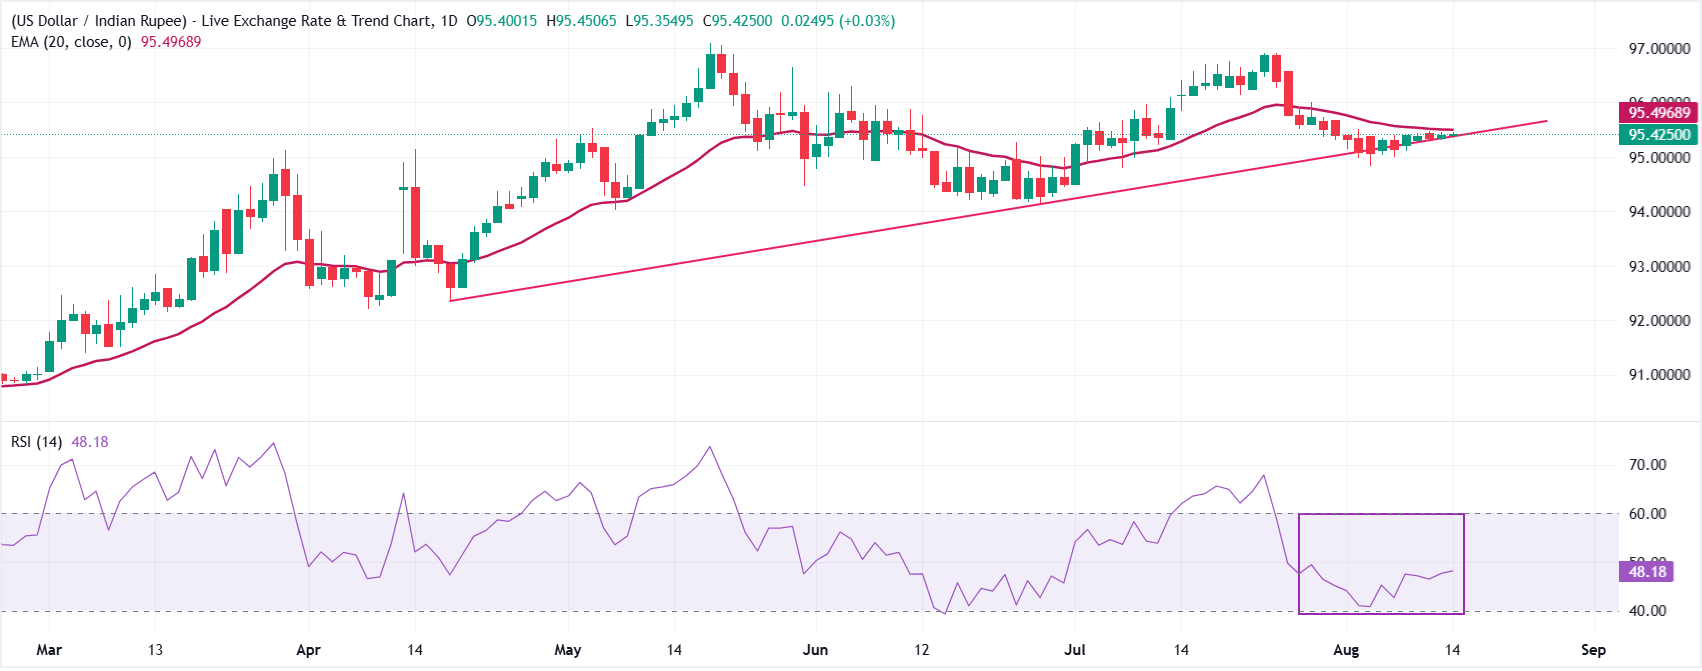
USD/INR trades at 95.42, close to the upward support trendline at 95.36, which coincides with the 20-day exponential moving average.
This configuration reflects a volatility contraction, with the Relative Strength Index (RSI) hovering steadily near 48.
On the topside, major resistances are the July 29 high near 96.00 and the all-time high at around 97.10. On the downside, the first layer of support is the upward-sloping trendline at 95.36, where a decisive breakdown would reinforce the bearish tone and expose the pair to the June 26 low at 94.15.
(The technical analysis of this story was written with the help of an AI tool. Know more.)
Economic Indicator
WPI Inflation
The WPI Inflation released by the Ministry of Commerce and Industry is a measure of price movements similar to the Consumer Price Indices (CPI). Generally, a high reading is seen as positive (or bullish) for the Rupee, while a low reading is seen as negative (or bearish).