
The Indian rupee has fallen to close to its record low this week. USDINR closed at 94.25, testing its all-time low of almost 95, that was reached two weeks ago. Meanwhile, oil prices keep climbing. Brent crude oil closed at $104, close to its recent highs since the West Asia conflict began.
In the last few weeks, news about the West Asia conflict has been driving both crude oil and the rupee. When there is escalation, the rupee falls and crude oil goes up. When there is de-escalation, the rupee rises and crude oil falls.
The RBI has been intervening in the rupee market to curb volatility. But ultimately, it can’t alter the direction of the currency. The oil supply shock creates two headwinds for the rupee.
The Mechanics of Depreciation: Import Bills and Outflows
First, it increases the import bill. This increases demand for dollars, relative to rupees. Second, it increases foreign portfolio outflows, which also increases the demand for dollars.
The relationship between the rupee and crude oil is not constant. Here is a chart of the one-month correlation between returns on brent crude oil and USDINR (rupees per one dollar). The data goes from April 2025 until the present.
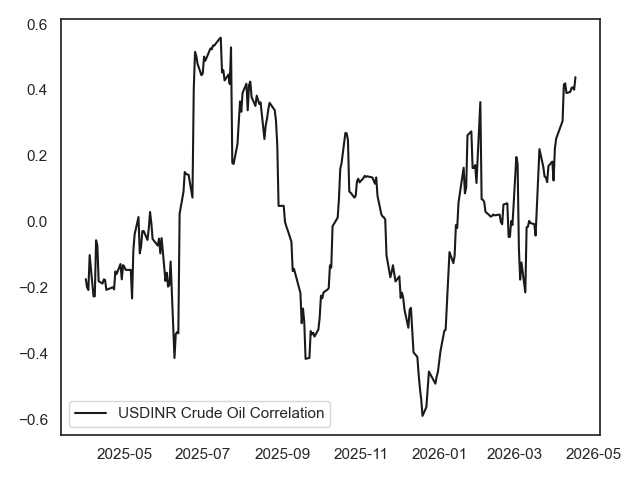
When the correlation is positive, it means that when oil goes up, USDINR tends to go up (i.e. the rupee tends to fall). When this number is negative, it is the opposite. When this number is close the zero, the relationship is weaker. The further it is from zero, the stronger the relationship.
What can we learn from this? First, the correlation varies over time. The latest value is 44%, indicating a strong positive correlation. The recent increase in the correlation is driven by the West Asia conflict. Since the conflict began, higher oil prices are associated with a falling rupee.
But this hasn’t always been the case.
Historical Outliers: Tariffs and Supply Constraints
For much of 2026, the correlation has been low or negative. It is instructive to look at the last instance of a positive correlation. In July 2025, the correlation went up to 55%. What was going on at that time?
July and August 2025 were the peak of US tariffs on India. At that time, the US had imposed 50% tariffs on India, to pressure India into reducing oil purchases from Russia. That event causes significant volatility in Indian equity markets. This, combined with an expected reduction in Russian oil supply, meant that the rupee fell while oil prices rose.
Decoding the 44% Correlation Peak
What we can learn from this is that crude oil and the rupee are negatively correlated during periods of market turmoil. This particularly applies when oil prices are driven by supply constraints.
Outside of these periods, the relationship between the two is weaker. In normal times, oil prices are driven by demand growth. And in this scenario, a stronger Indian economy implies higher oil demand and a higher rupee. The markets will return to this scenario when the West Asia conflict ends or subsides.
Disclaimer:
Note: The purpose of this article is to share interesting charts, data points and thought-provoking opinions. It is NOT a recommendation. If you wish to consider an investment, you are strongly encouraged to consult your advisor. This article is for strictly educative purposes only.
Asad Dossani is an assistant professor of finance at Colorado State University. His research covers derivatives, forecasting, monetary policy, currencies, and commodities. He has a PhD in Economics. He has previously worked as a research analyst at Equitymaster, and as a financial analyst at Deutsche Bank.


