After a long pause, the UK published a full set of inflation indicators, which overall turned out to be softer than expected, increasing pressure on the pound and allowing the stock market to gain against the tide.
The remained unchanged in September, maintaining an annual growth rate of 3.8%, against an expected acceleration to 4.0%. The slowed to 3.5% y/y, against 3.6% in August and 3.8% in July.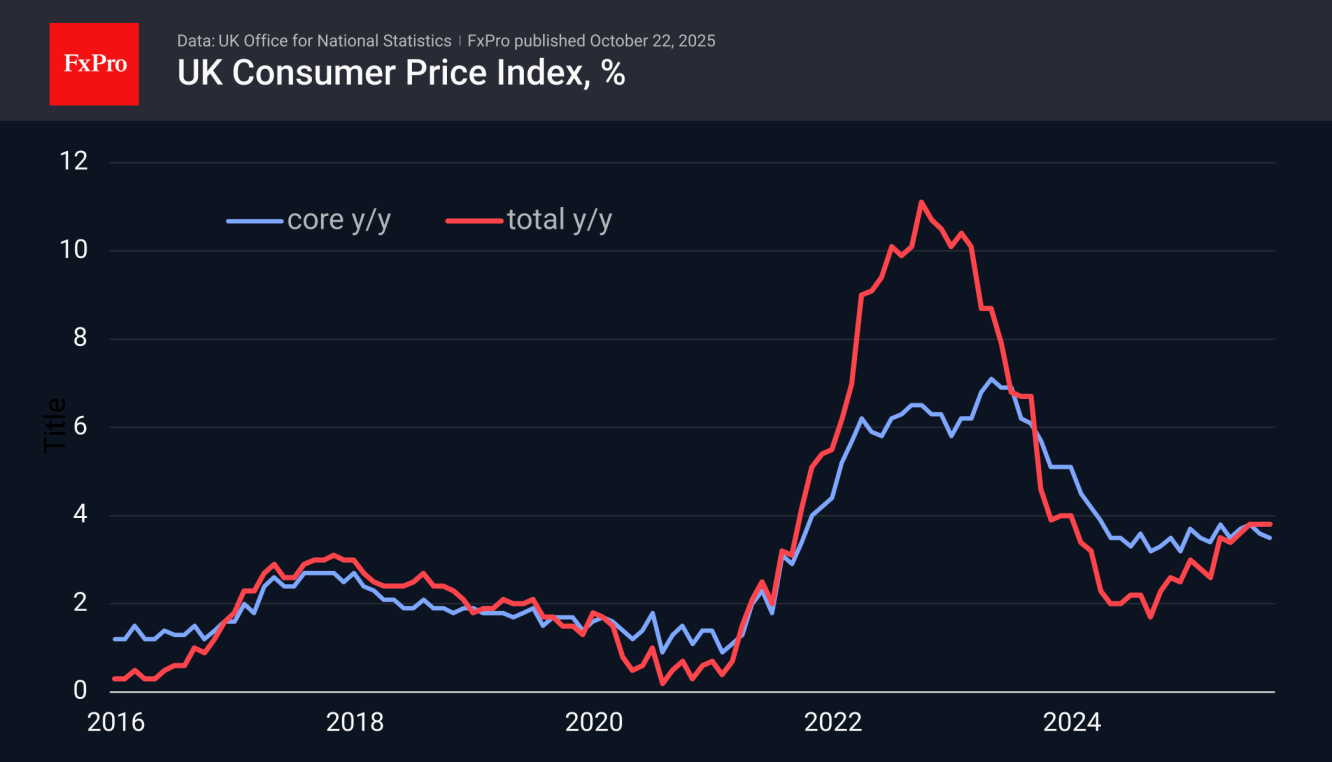
The key factor of uncertainty was producer prices. This data has not been published since January due to a revision by the statistical agency. Indicators are accelerating but remain relatively low and below average forecasts. Input are up 0.7% y/y, while are up 3.4% y/y. Both indicators are growing more slowly than CPI, without fuelling inflation.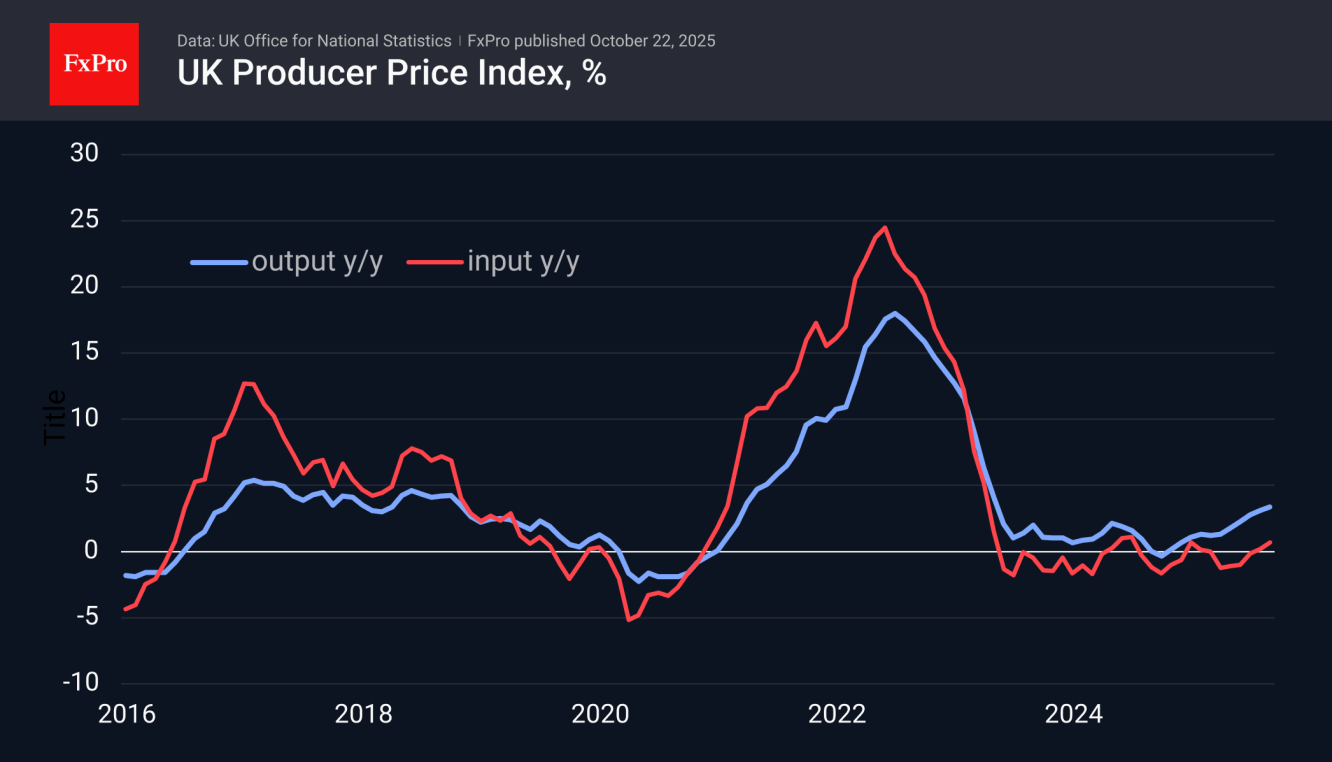
We are seeing a classic market reaction, with weaker-than-expected inflation triggering a reassessment of the outlook for monetary policy.
After the release, the British pound lost 0.5% against the dollar, falling to a seven-day low of 1.3320. Since the beginning of the month, has been finding resistance in the form of a 50-day moving average, which is also showing a gradual downward reversal. Since April, the pound has quickly found support on dips to 1.3250.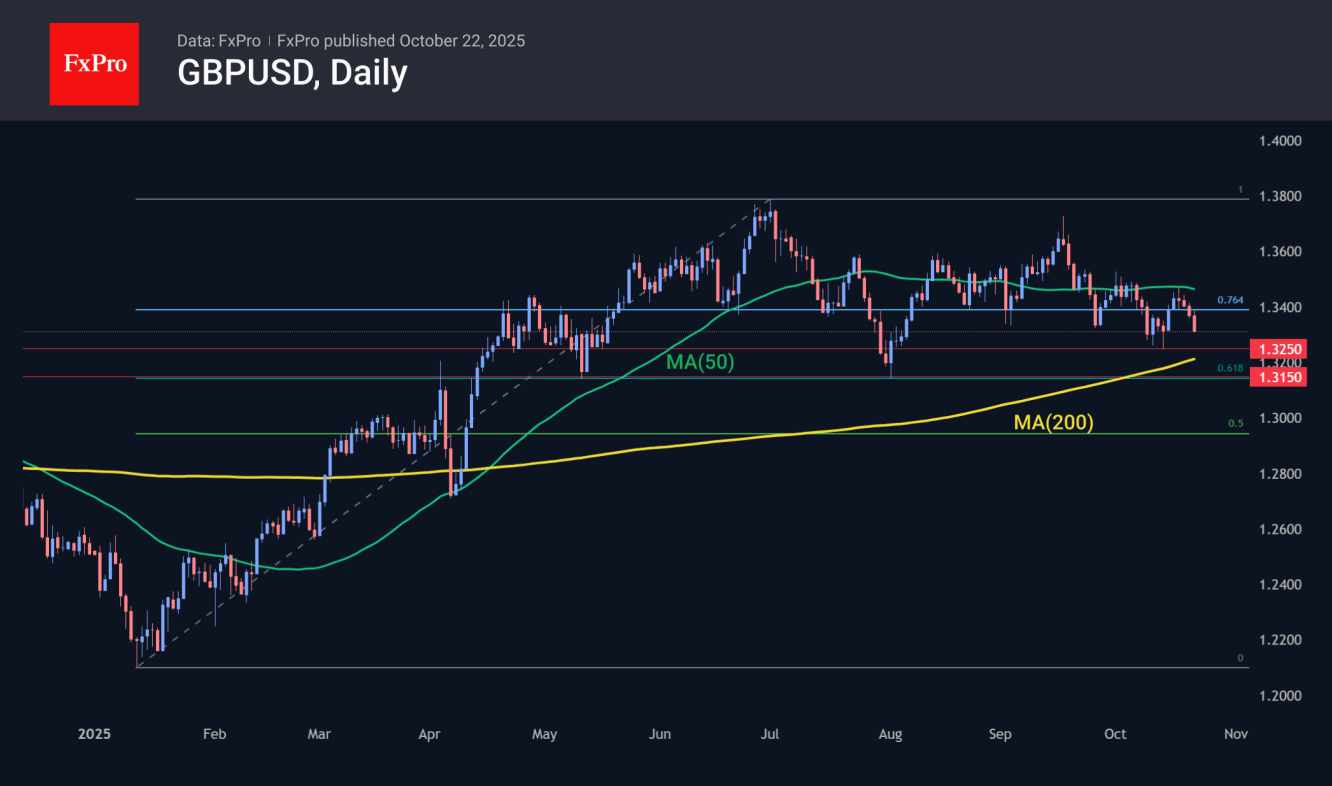
This is now the area of recent local lows, where the 200-day moving average also pulls up. A break below this line will signal a break in the ’s retreat trend. A break below 1.3150 will take the pound beyond the correctional pullback, and events may develop much faster, removing the narrative of dollar depreciation from the agenda.
The British market, represented by the , has gained 1% since the start of the day, with 0.9 percentage points of this increase occurring after the publication. The index has returned to territory above 9500, above which it closed only once on October 8th.
At the end of last week, the market turned sharply upward after touching the 50-day moving average, which has been acting as support since May. The pound’s weakness supports the stock market, linked to growing expectations of monetary policy easing. The British index is only 1% away from its historic highs and could move to renew them as early as this week.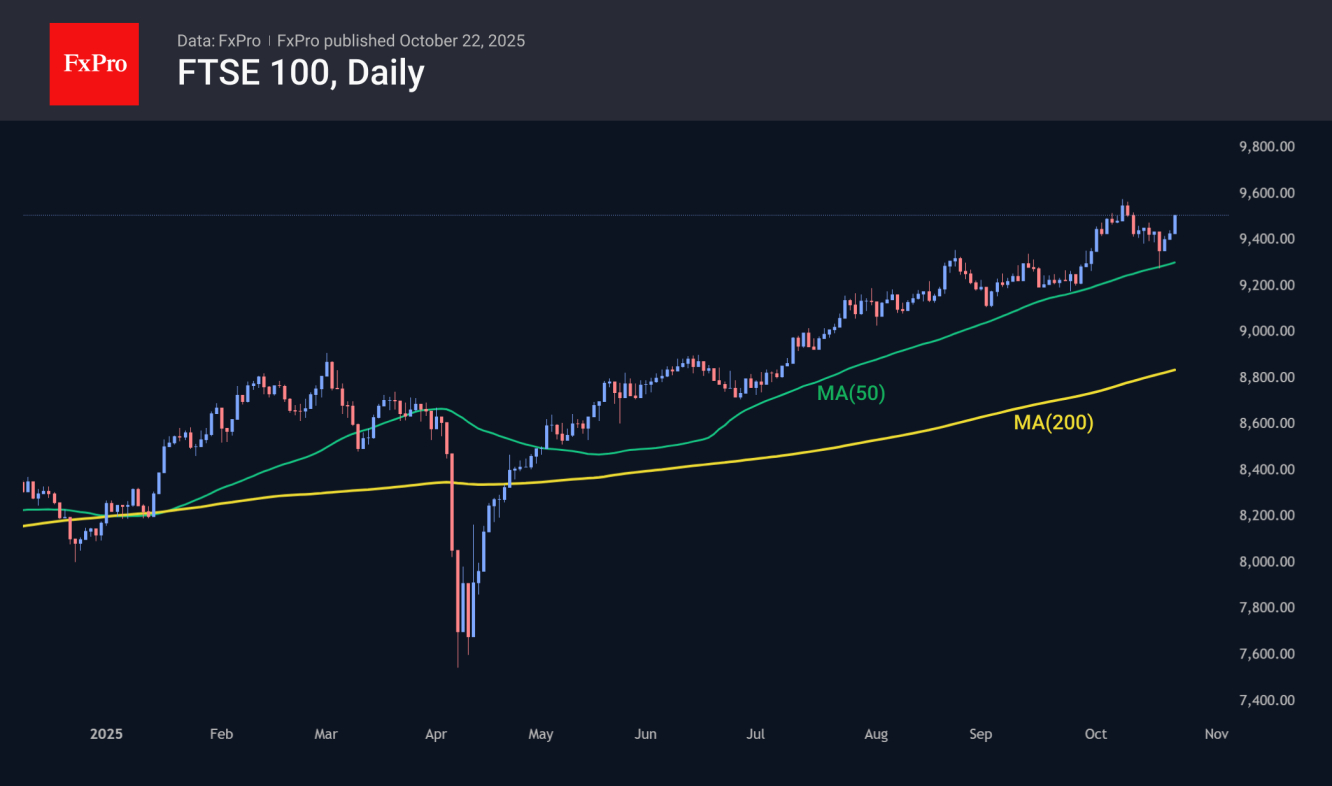
The FxPro Analyst Team


