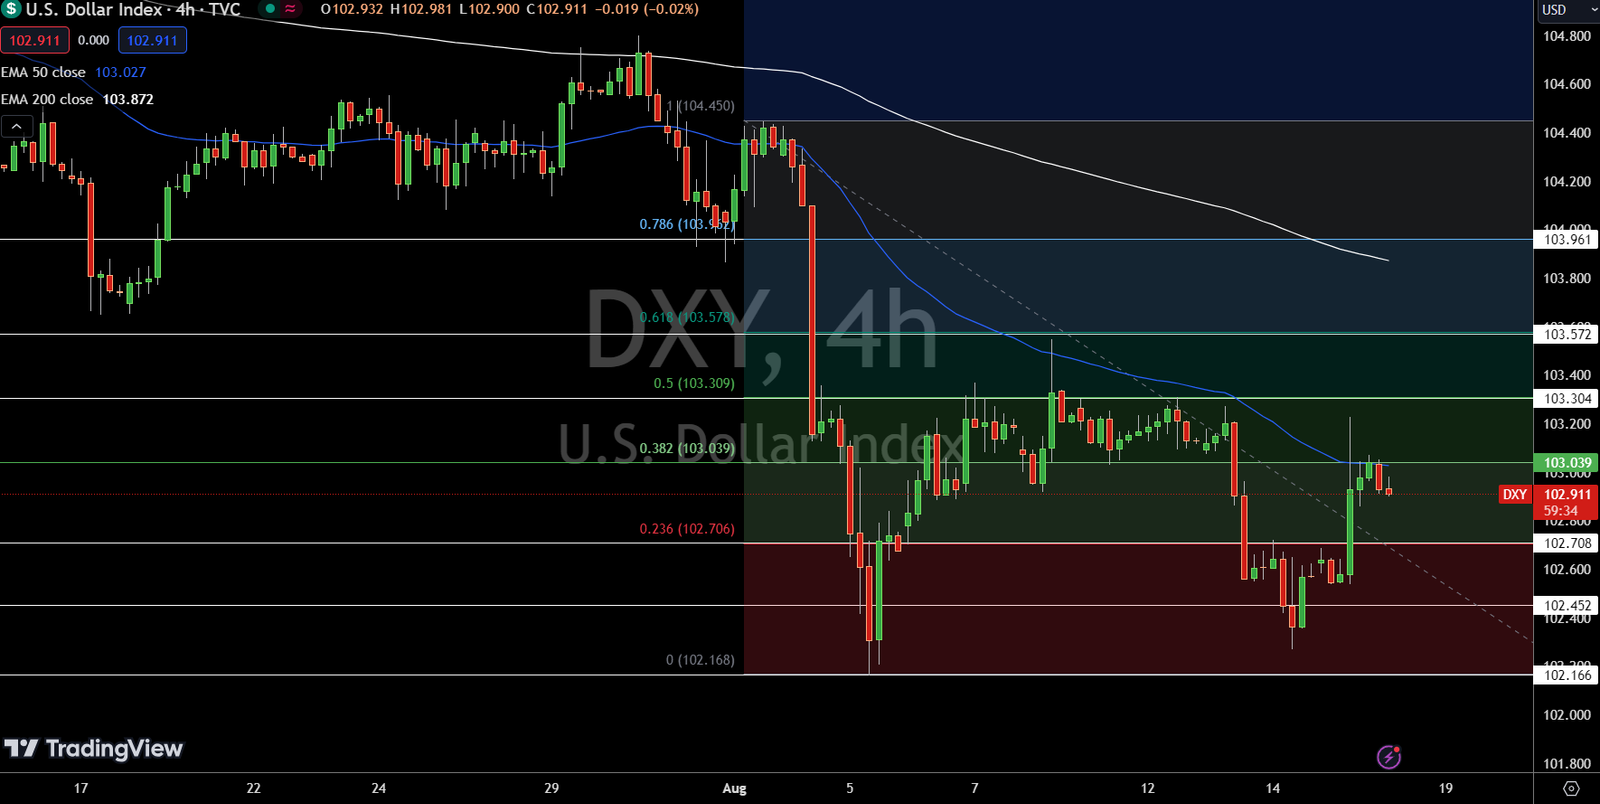
The Dollar Index (DXY) is currently trading at $102.911, down 0.06% on the day. The index has recently retraced to the 38.2% Fibonacci level at $103.039, where a bearish engulfing candle has formed on the 4-hour chart.
This suggests the potential for further downside correction. Both the 50-day and 200-day EMAs, positioned at $103.027 and $103.872 respectively, indicate bearish momentum.
Immediate support is at $102.708, with further downside targets at $102.452 and $102.166. The key level to watch is $103.039—if the index breaks below this, expect a deeper decline toward $102.70. Bearish below $103.039; a break above could shift the momentum back to bullish.
EUR/USD Technical Forecast
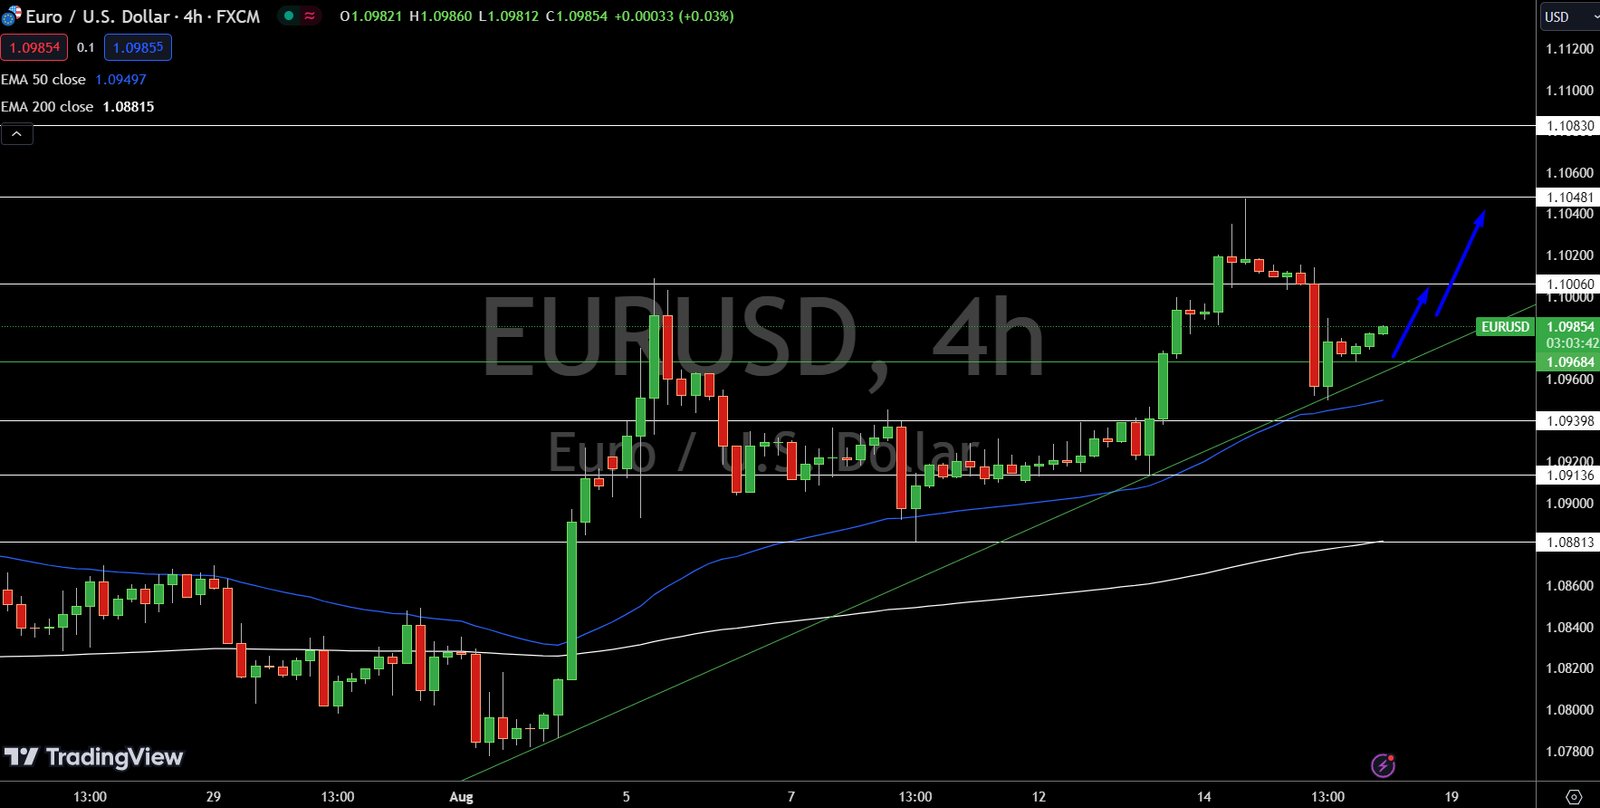
EUR/USD is trading at $1.09854, up 0.04% on the day, showing a bullish trend on the 4-hour chart. The pair is supported by an upward trendline and is currently holding above the pivot point at $1.09684.
The 50-day EMA at $1.09497 and the 200-day EMA at $1.08815 are reinforcing the bullish outlook. Immediate resistance is at $1.10060, with further resistance at $1.10481 and $1.10830.
The recent bullish candle formation supports the potential for further upside. A break below $1.09684 could shift momentum toward a bearish trend. Bullish above $1.09684, but a break below could lead to a sharp sell-off.


