EUR/USD Current price: 1.1698
- The German IFO survey showed the Business Climate improved in August.
- Market players finished digesting Fed Chair Jerome Powell’s dovish shift.
- EUR/USD consolidates gains around 1.1700, bulls retain control.
The EUR/USD pair hovers around the 1.1700 mark, easing from Friday’s peak at 1.1742, as investors finished digesting fresh expectations for a Federal Reserve (Fed) interest rate cut following Chair Jerome Powell’s statement at the Jackson Hole Symposium.
The Euro (EUR) eased despite encouraging German data. The August IFO Survey shows the Business Climate improved to 89 from the 88.6 posted in July, also beating the expected 88.6. Expectations also improved, with the index hitting 91.6, better than the 90.2 anticipated. On a negative note, the assessment of the current situation eased modestly, from the 86.5 posted in the previous month to 86.4.
Conversely, the US Dollar (USD) benefited from easing optimism. Asian shares edged higher, but most European indexes trade just below their opening levels, dragging Wall Street’s futures lower.
Data-wise, the United States (US) published the July Chicago Fed National Activity Index, which printed at -0.19, slightly better than the previous revised -0.18. Coming up next, the country will release the July New Home Sales and the August Dallas Fed Manufacturing Business Index.
EUR/USD short-term technical outlook
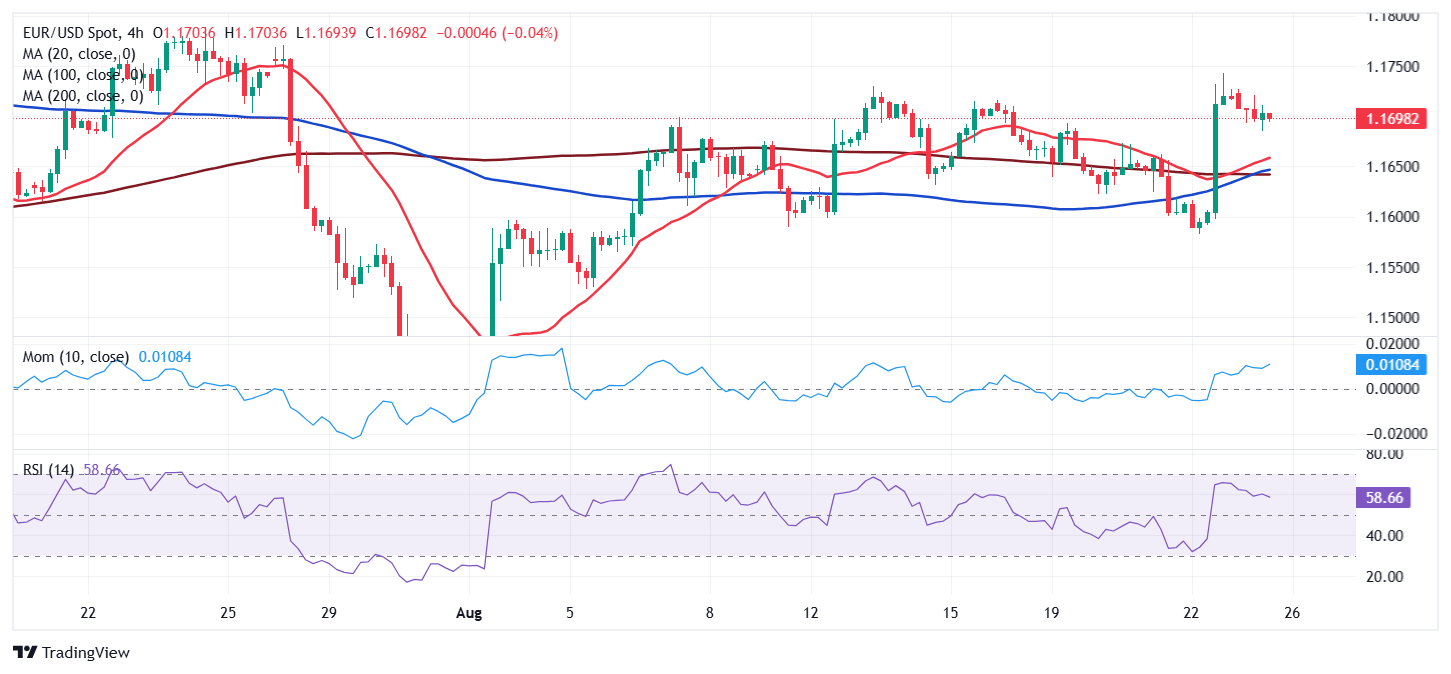
The EUR/USD pair trades at the upper end of Friday’s range, and the daily chart shows the bullish momentum eased, but the bulls hold the grip. The pair stands above all its moving averages, with a flat 20 Simple Moving Average (SMA) hovering around 1.1620, well above bullish 100 and 200 SMAs. At the same time, technical indicators turned modestly lower, yet hold within positive levels and not far from their recent peaks.
In the near term, and according to the 4-hour chart, EUR/USD is neutral-to-bullish. Technical indicators in the mentioned time frame head nowhere within positive levels, as EUR/USD develops above all its moving averages. The 20 SMA is slowly grinding higher above the longer ones, while the 100 SMA also aims modestly higher, reflecting buyers’ strength.
Support levels: 1.1660 1.1620 1.1570
Resistance levels: 1.1740 1.1785 1.1825