
USD/CAD has traded quietly this week, slipping from 1.3800 to 1.3720 despite steep US import tariffs of 10–40% kicking in against countries without trade deals. Canadian employment data due today could still inject volatility before the weekend, with the unemployment rate expected to rise to 7.0% for the first time in four years.
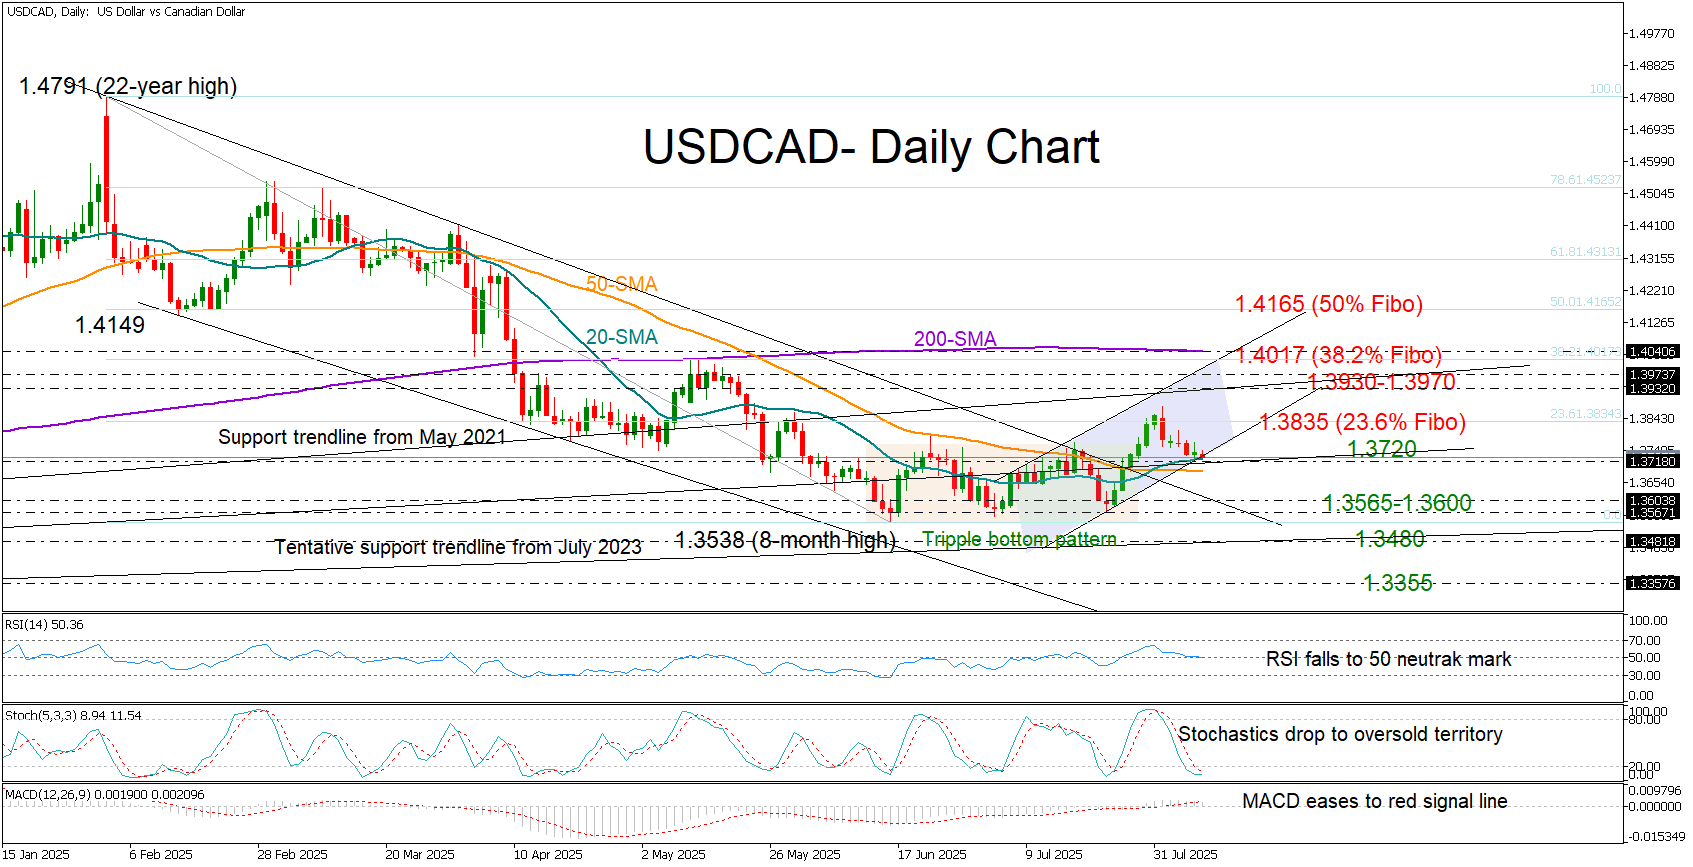
Although bullish momentum has been lacking lately, the pair appears to have laid the groundwork for a potential positive trend reversal. Having confirmed a bullish triple-bottom pattern, the price posted a new higher high near 1.3877 before upside pressures were capped by the 23.6% Fibonacci retracement level of the 2025 downtrend near 1.3835. The bullish crossover between the 20- and 50-day SMAs is adding to the constructive signals, with the price now seeking fresh buying interest near the protective 20-day SMA and the constraining trendline from July 2023 at 1.3720.
The stochastic oscillator suggests that the latest decline is overdone and that a pivot higher could be imminent. However, the downward slope in both the RSI and MACD indicates that momentum could stay weak.
If the pair manages to break above the 1.3835 barrier, the next hurdle could appear within the April–May range of 1.3930–1.3970. Slightly higher, the 200-day SMA and the 38.2% Fibonacci level at 1.4017 could challenge any attempt at a full bullish trend reversal above May’s high.
On the downside, a close below the 50-day SMA at 1.3685 could trigger another critical test near the 1.3600 level and the triple-bottom area of 1.3565. If this floor gives way, the tentative support trendline from July 2023 at 1.3480 could prevent a deeper fall towards the January 2024 base near 1.3355.
In summary, USD/CAD bulls have not yet surrendered to the bears. The 1.3720 zone could still serve as a springboard for a renewed positive trajectory.