- Australian Dollar advances as US Dollar holds losses ahead of labor market data.
- The US Nonfarm Payrolls are expected to rise by about 75,000 in August, while the Unemployment Rate is projected at 4.3%.
- The AUD appreciates as robust July Trade Surplus and Q2 GDP figures eased expectations of additional RBA rate cuts.
The Australian Dollar (AUD) gains ground against the US Dollar (USD) on Friday, retracing its recent losses registered in the previous session. The AUD/USD pair appreciates as the US Dollar struggles amid softer-than-expected United States (US) job data.
Traders are awaiting further labor market data on Friday that could shape the US Federal Reserve’s (Fed) policy decision in September. Economists project US Nonfarm Payrolls to add about 75,000 jobs in August, while the Unemployment Rate is seen at 4.3%. Any softer data would boost the odds of a Federal Reserve rate cut in September.
The US Dollar Index (DXY), which measures the value of the US Dollar against six major currencies, is retracing its recent gains and trading around 98.10 at the time of writing. The CME FedWatch tool indicates a pricing in more than 99% of a 25-basis-point (bps) rate cut by the Fed at the September policy meeting, up from 87% a week ago.
The US Initial Jobless Claims rose to 237K for the week ending August 30, against the previous reading of 229K. This figure came in above the market consensus of 230K. Meanwhile, ADP Employment Change showed that employment rose by 54,000 in August, which came in below the expectation of 65K. This reading followed a 106K (revised from 104K) increase recorded in July.
The Australian Dollar (AUD) gains ground against its peers as a solid July Trade Surplus, along with robust Q2 GDP figures, eased expectations of additional Reserve Bank of Australia (RBA) rate cuts. Swaps are now assigning nearly a 90% probability that the central bank will keep policy unchanged in late September.
Australian Dollar advances on easing bets of RBA rate cuts
- The Australian Bureau of Statistics (ABS) reported on Thursday that Australia’s Trade Balance increased to 7,310 million month-over-month in July, from 5,366 million (revised from 5,365 million) the prior month. The trade surplus widened against the expected decline to 4,920 million. Australia’s Exports rose by 3.3% MoM in July from 6.3% (revised from 6.0%) seen prior. Meanwhile, Imports declined by 1.3% MoM in July, compared to a fall of 1.5% (revised from -3.1%) seen in June.
- The Australian Bureau of Statistics reported on Wednesday that Gross Domestic Product (GDP) rose 0.6% quarter-over-quarter in Q2, following the 0.3% growth in Q1 and surpassing the expectations of 0.5% expansion. Meanwhile, the annual Q2 GDP grew by 1.8%, compared with the 1.4% growth in Q1, and was above the consensus of a 1.6% increase.
- Australia’s Monthly Consumer Price Index rose 2.8% year-over-year in July, beating both the previous 1.9% increase and the 2.3% forecast. The hotter inflation in July dampened the likelihood of a Reserve Bank of Australia (RBA) rate cut anytime soon, continuing to provide support for the Australian Dollar.
- China’s Caixin Services Purchasing Managers’ Index (PMI) unexpectedly rose to 53.0 in August from 52.6 in July. The data came in above the market forecast of 52.5 in the reported period. Caixin Manufacturing PMI jumped to 50.5 in August from 49.5 in July. It is worth noting that any change in the Chinese economy could influence AUD as China and Australia are close trading partners.
- Federal Reserve Bank of Chicago President Austan Goolsbee said on Friday that the US labor market might be deteriorating, adding that there is a bit of wait-and-see because of uncertainty.
- Federal Reserve (Fed) Bank of New York President John Williams warned on Thursday that although he expects Fed interest rates to continue declining at a slow pace.
- Reuters reported late Thursday that US President Donald Trump said that his administration would impose tariffs on semiconductor imports from firms not moving production to the United States. Moreover, the Trump administration is set to begin renegotiating the US-Mexico-Canada free trade deal, according to The Wall Street Journal.
- Data from the Institute for Supply Management (ISM) reported on Thursday that the Services PMI rose to 52.0 in August, up from 50.1 in the previous month and exceeding analysts’ forecasts of 51.0.
- US JOLTS data showed on Wednesday that July job openings declined to 7.18 million from 7.35 million, marking the weakest level since September 2024 and missing forecasts of 7.4 million.
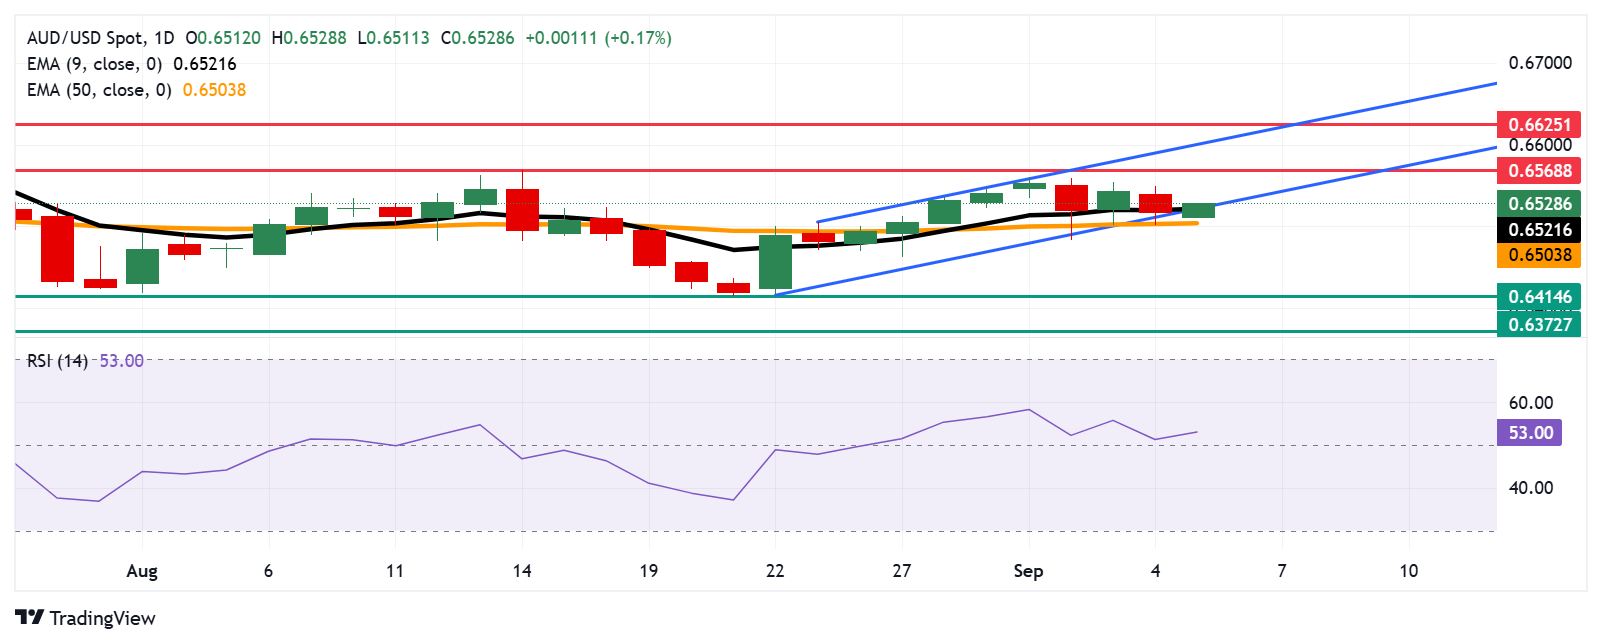
Australian Dollar recovers from confluence support zone near 0.6500
AUD/USD is trading around 0.6530 on Friday. The technical analysis of the daily chart shows the pair is positioned on the lower boundary of the ascending channel pattern. Further movement will offer a clear directional trend. The pair is positioned slightly above the nine-day Exponential Moving Average (EMA), indicating short-term price momentum is still stronger.
On the upside, the AUD/USD pair may target the five-week high of 0.6568, reached on August 14, followed by the upper boundary of the ascending channel around 0.6600. A break above the channel would strengthen the bullish bias and support the pair to test the nine-month high of 0.6625, which was recorded on July 24.
The immediate support appears at the nine-day EMA of 0.6521, aligned with the ascending channel’s lower boundary and followed by the 50-day EMA at 0.6503. A break below this crucial support zone would cause the emergence of the bearish bias and prompt the AUD/USD pair to test its three-month low of 0.6414, recorded on August 21.
AUD/USD: Daily Chart
Australian Dollar Price Today
The table below shows the percentage change of Australian Dollar (AUD) against listed major currencies today. Australian Dollar was the strongest against the US Dollar.
| USD | EUR | GBP | JPY | CAD | AUD | NZD | CHF | |
|---|---|---|---|---|---|---|---|---|
| USD | -0.18% | -0.25% | -0.10% | -0.09% | -0.36% | -0.37% | -0.18% | |
| EUR | 0.18% | -0.05% | 0.00% | 0.09% | -0.09% | -0.16% | 0.00% | |
| GBP | 0.25% | 0.05% | 0.06% | 0.13% | -0.02% | -0.13% | 0.09% | |
| JPY | 0.10% | 0.00% | -0.06% | 0.08% | -0.17% | -0.22% | 0.09% | |
| CAD | 0.09% | -0.09% | -0.13% | -0.08% | -0.21% | -0.27% | -0.06% | |
| AUD | 0.36% | 0.09% | 0.02% | 0.17% | 0.21% | -0.10% | 0.15% | |
| NZD | 0.37% | 0.16% | 0.13% | 0.22% | 0.27% | 0.10% | 0.21% | |
| CHF | 0.18% | -0.00% | -0.09% | -0.09% | 0.06% | -0.15% | -0.21% |
The heat map shows percentage changes of major currencies against each other. The base currency is picked from the left column, while the quote currency is picked from the top row. For example, if you pick the Australian Dollar from the left column and move along the horizontal line to the US Dollar, the percentage change displayed in the box will represent AUD (base)/USD (quote).
Economic Indicator
Nonfarm Payrolls
The Nonfarm Payrolls release presents the number of new jobs created in the US during the previous month in all non-agricultural businesses; it is released by the US Bureau of Labor Statistics (BLS). The monthly changes in payrolls can be extremely volatile. The number is also subject to strong reviews, which can also trigger volatility in the Forex board. Generally speaking, a high reading is seen as bullish for the US Dollar (USD), while a low reading is seen as bearish, although previous months’ reviews and the Unemployment Rate are as relevant as the headline figure. The market’s reaction, therefore, depends on how the market assesses all the data contained in the BLS report as a whole.