- The Australian Dollar maintains its position as Retail Sales climbed 1.2% MoM in June, compared to the expected 0.4% increase.
- China’s NBS Manufacturing Purchasing Managers’ Index fell to 49.3, while the Non-Manufacturing PMI eased to 50.1 in July.
- The Fed left its benchmark interest rate in a range of 4.25%-4.5% in July.
The Australian Dollar (AUD) appreciated on Thursday, halting its five-day losing streak. The AUD/USD pair gained ground following the release of key economic data from Australia and its close trading partner, China. Traders shift their focus toward the US Personal Consumption Expenditures (PCE) – Price Index, due on Thursday, which is expected to accelerate slightly. On Friday, Nonfarm Payrolls (NFP) is expected to hold in positive territory, which could add further fuel to rate hold fears.
Australia’s Retail Sales rose 1.2% month-over-month in June, compared to 0.5% in May (revised from 0.2%). The reading came in above the market expectations of 0.4%. Retail Sales climbed 0.3% QoQ in the second quarter, compared to 0.1% in Q1 (revised from 0%).
Australia’s Building Permits, showing the number of total dwellings approved in Australia, climbed by 11.9% month-over-month in June, surpassing the market expectations of a 2% rise and the downwardly revised 2.2% increase in May. This marked the second consecutive month of growth in dwelling approvals and the strongest since May 2023.
China’s NBS Manufacturing Purchasing Managers’ Index (PMI) dropped to 49.3 in July, as against 49.7 reported in June. The market forecast was 49.7. The NBS Non-Manufacturing PMI eased to 50.1 in July, versus June’s 50.5 and below the estimated 50.3 figure.
Australian Dollar advances as US Dollar halts winning streak
- The US Dollar Index (DXY), which measures the value of the US Dollar against six major currencies, is halting its winning streak and trading around 99.80 at the time of writing. However, the Greenback gained ground after the Federal Reserve (Fed) decided to hold its benchmark federal funds rate in a range of 4.25%-4.5% at its July meeting on Wednesday, as widely expected.
- Fed Chair Jerome Powell said in a post-policy conference that the US central bank has “made no decisions” about a potential policy change in September, and it may take a bit to assess the effect of tariffs on consumer prices.
- US Gross Domestic Product (GDP) expanded at an annual rate of 3.0% for the April through June period. This figure followed the 0.5% contraction in the first quarter and came in stronger than the expectation of 2.4%.
- US President Donald Trump announced a new trade deal with South Korea, imposing a 15% US tariff on imports from South Korea. The agreement also includes a $350 billion commitment from South Korea toward US-owned and controlled investments, Reuters reported on Wednesday.
- US Commerce Secretary Howard Lutnick said that the United States (US) has made trade agreements with Cambodia and Thailand.
- The United States and European Union reached a framework trade agreement on Sunday that sets 15% tariffs on most European goods, taking effect on August 1. This deal has ended a months-long stand-off, per Bloomberg.
- US Treasury Secretary Scott Bessent said that the US and China will continue talks over maintaining a tariff truce before the deadline in two weeks, and Trump will make the final decision on any extension. Bessent tamped down any expectation of Trump rejecting the extension. It is important to note that any changes in the Chinese economy could impact the AUD as China and Australia are close trade partners.
- China’s Finance Minister Lan Fo’an said on Tuesday that the country will ramp up fiscal support to bolster domestic consumption and mitigate mounting economic headwinds. He emphasized that uncertainty around China’s development environment is growing and Beijing will adopt more proactive fiscal policies to help stabilise growth.
- Australia’s Consumer Price Index (CPI) rose 0.7% quarter-over-quarter in the second quarter, against the 0.9% increase in Q1 and the expected growth of 0.8%. Annually, CPI inflation eased to 2.1% in Q2, compared to 2.4% prior and below the market consensus of 2.2%.
- The monthly Consumer Price Index rose by 1.9% YoY in June, compared to the previous reading of a 2.1% increase. The RBA Trimmed Mean CPI for Q2 rose 0.6% and 2.7% on a quarterly and annual basis, respectively. Markets estimated an increase of 0.7% QoQ and 2.7% YoY in the quarter to June.
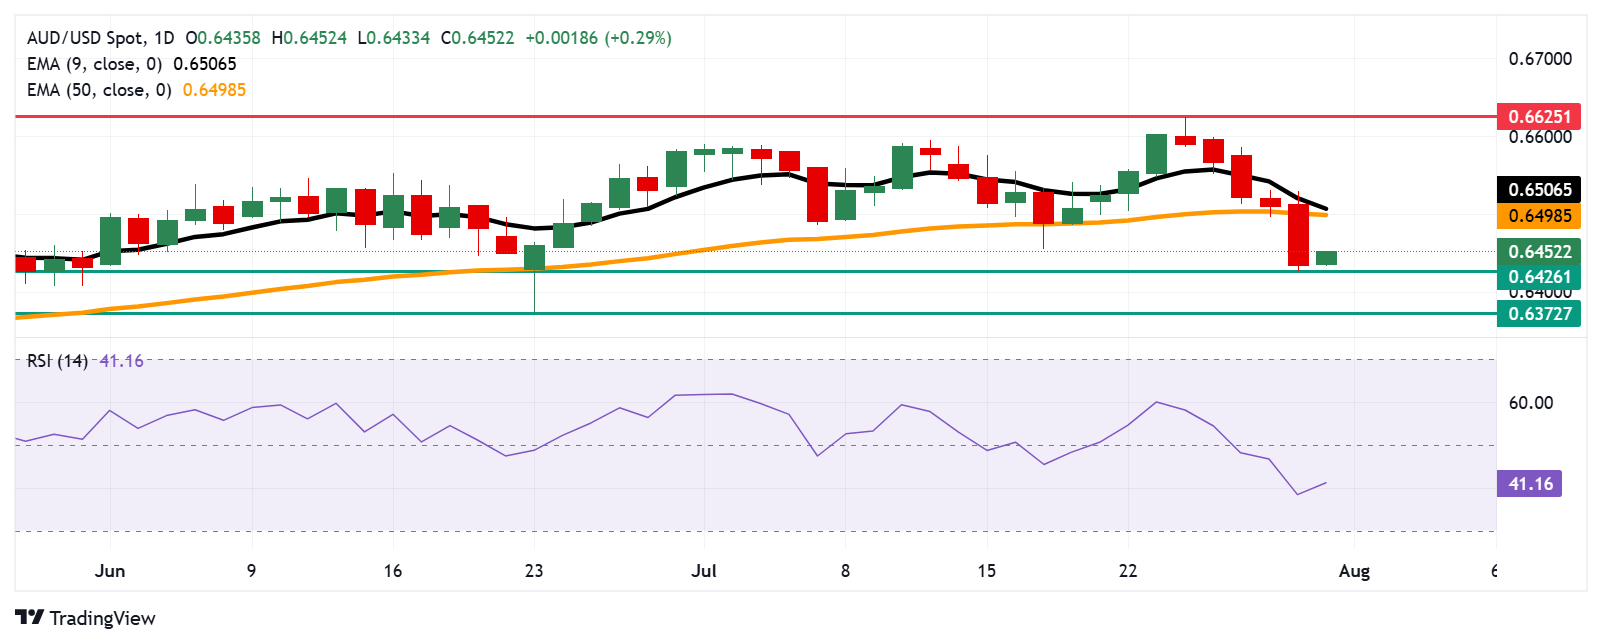
Australian Dollar hovers near 0.6450 after rebounding from monthly lows
AUD/USD is trading around 0.6450 on Thursday. The daily chart’s technical analysis indicates a bearish bias as the 14-day Relative Strength Index (RSI) has moved below the 50 mark. Additionally, the pair remains below the nine-day Exponential Moving Average (EMA), indicating that short-term price momentum is weaker.
On the downside, the AUD/USD pair could find the primary support at the monthly low of 0.6426, which was recorded on July 30. A break below this level could put downward pressure on the pair to test a two-month low at 0.6372, recorded on June 23.
The AUD/USD pair may target the initial barrier at the 50-day EMA of 0.6498, followed by the nine-day EMA of 0.6506. A break above these levels could strengthen the short- and medium-term price momentum and support the pair to explore the region around the eight-month high at 0.6625.
AUD/USD: Daily Chart
Australian Dollar PRICE Today
The table below shows the percentage change of Australian Dollar (AUD) against listed major currencies today. Australian Dollar was the strongest against the US Dollar.
| USD | EUR | GBP | JPY | CAD | AUD | NZD | CHF | |
|---|---|---|---|---|---|---|---|---|
| USD | -0.45% | -0.29% | -0.36% | -0.08% | -0.56% | -0.64% | -0.38% | |
| EUR | 0.45% | 0.15% | 0.09% | 0.37% | -0.14% | -0.18% | 0.09% | |
| GBP | 0.29% | -0.15% | -0.06% | 0.22% | -0.30% | -0.33% | -0.07% | |
| JPY | 0.36% | -0.09% | 0.06% | 0.29% | -0.18% | -0.20% | 0.03% | |
| CAD | 0.08% | -0.37% | -0.22% | -0.29% | -0.42% | -0.56% | -0.29% | |
| AUD | 0.56% | 0.14% | 0.30% | 0.18% | 0.42% | -0.04% | 0.22% | |
| NZD | 0.64% | 0.18% | 0.33% | 0.20% | 0.56% | 0.04% | 0.26% | |
| CHF | 0.38% | -0.09% | 0.07% | -0.03% | 0.29% | -0.22% | -0.26% |
The heat map shows percentage changes of major currencies against each other. The base currency is picked from the left column, while the quote currency is picked from the top row. For example, if you pick the Australian Dollar from the left column and move along the horizontal line to the US Dollar, the percentage change displayed in the box will represent AUD (base)/USD (quote).
Economic Indicator
Core Personal Consumption Expenditures – Price Index (MoM)
The Core Personal Consumption Expenditures (PCE), released by the US Bureau of Economic Analysis on a monthly basis, measures the changes in the prices of goods and services purchased by consumers in the United States (US). The PCE Price Index is also the Federal Reserve’s (Fed) preferred gauge of inflation. The MoM figure compares the prices of goods in the reference month to the previous month.The core reading excludes the so-called more volatile food and energy components to give a more accurate measurement of price pressures. Generally, a high reading is bullish for the US Dollar (USD), while a low reading is bearish.