- The Australian Dollar remains steady as Trump keeps the 10% baseline tariffs on Australian goods unchanged.
- China’s Caixin Manufacturing PMI slipped to 49.5 in July, down from 50.4 in June, and below the 50.3 expected.
- US Nonfarm Payrolls is expected to hold in positive territory.
The Australian Dollar (AUD) edges higher on Friday, halting its six-day losing streak. The AUD/USD pair remains steady as Australia was spared from the latest United States (US) tariff hikes, indicating that President Donald Trump had left the 10% baseline tariffs on Australian goods unchanged. Traders await the United States (US) Nonfarm Payrolls (NFP), due later in the day, which is expected to hold in positive territory.
Australia’s Trade Minister Don Farrell stated on Friday that the White House had confirmed no country enjoys lower reciprocal tariffs than Australia. He added that this gives Australian products a competitive edge in the US market, potentially boosting exports. “We will support all our exporters in taking full advantage of this opportunity to increase export volumes,” Farrell said.
Australia’s Producer Price Index (PPI) rose by 0.7% quarter-over-quarter in the second quarter, against the expected and previous increase of 0.9%. The annual PPI climbed 3.4% in Q2 versus 3.7% prior. Meanwhile, China’s Caixin Manufacturing Purchasing Managers Index (PMI) eased to 49.5 in July from 50.4 in June. This figure came in below the market forecast of 50.3.
US Treasury Secretary Scott Bessent said during an interview on CNBC’s “Squawk Box” on Thursday, expressing confidence that the US and China may reach a trade deal as a key tariff deadline nears. Bessent said, “I believe that we have the makings of a deal.” “There are still a few technical details to be worked out on the Chinese side between us. I’m confident that it will be done, but it’s not 100% done,” he added.
Australian Dollar edges higher despite stronger US Dollar ahead of Nonfarm Payrolls
- The US Dollar Index (DXY), which measures the value of the US Dollar against six major currencies, remains stronger and is trading around 100.00 at the time of writing.
- President Trump signed an executive order on Thursday, imposing tariffs ranging from 10% to 41%, set to go into effect on August 1, on US imports from dozens of countries and foreign locations, including Canada, India, and Taiwan, that failed to reach the trade deals deadline, per Reuters.
- Core US Personal Consumption Expenditure Price Index (PCE) inflation ticked higher in June, rising 0.3% MoM as many market participants had expected. On an annualized basis, PCE inflation accelerated to 2.6% YoY, outrunning the expected hold at 2.5%.
- The Federal Reserve (Fed) decided to hold its benchmark federal funds rate in a range of 4.25%-4.5% at its July meeting on Wednesday, as widely expected. Fed Chair Jerome Powell said in a post-policy conference that the US central bank has “made no decisions” about a potential policy change in September, and it may take a bit to assess the effect of tariffs on consumer prices.
- US Gross Domestic Product (GDP) expanded at an annual rate of 3.0% for the April through June period. This figure followed the 0.5% contraction in the first quarter and came in stronger than the expectation of 2.4%.
- US President Donald Trump announced a new trade deal with South Korea, imposing a 15% US tariff on imports from South Korea. The agreement also includes a $350 billion commitment from South Korea toward US-owned and controlled investments, Reuters reported on Wednesday.
- The United States and European Union reached a framework trade agreement on Sunday that sets 15% tariffs on most European goods, taking effect on August 1. This deal has ended a months-long stand-off, per Bloomberg.
- China’s Finance Minister Lan Fo’an said on Tuesday that the country will ramp up fiscal support to bolster domestic consumption and mitigate mounting economic headwinds. He emphasized that uncertainty around China’s development environment is growing and Beijing will adopt more proactive fiscal policies to help stabilise growth.
- China’s NBS Manufacturing Purchasing Managers’ Index (PMI) dropped to 49.3 in July, as against 49.7 reported in June. The market forecast was 49.7. The NBS Non-Manufacturing PMI eased to 50.1 in July, versus June’s 50.5 and below the estimated 50.3 figure.
- The Australian Bureau of Statistics reported on Thursday that Australia’s Retail Sales rose 1.2% month-over-month in June, compared to 0.5% in May (revised from 0.2%). The reading came in above the market expectations of 0.4%. Retail Sales climbed 0.3% QoQ in the second quarter, compared to 0.1% in Q1 (revised from 0%).
- Australia’s Building Permits, showing the number of total dwellings approved in Australia, climbed by 11.9% month-over-month in June, surpassing the market expectations of a 2% rise and the downwardly revised 2.2% increase in May. This marked the second consecutive month of growth in dwelling approvals and the strongest since May 2023.
- Australia’s Consumer Price Index (CPI) rose 0.7% quarter-over-quarter in the second quarter, against the 0.9% increase in Q1 and the expected growth of 0.8%. Annually, CPI inflation eased to 2.1% in Q2, compared to 2.4% prior and below the market consensus of 2.2%.
- The monthly Consumer Price Index rose by 1.9% YoY in June, compared to the previous reading of a 2.1% increase. The RBA Trimmed Mean CPI for Q2 rose 0.6% and 2.7% on a quarterly and annual basis, respectively. Markets estimated an increase of 0.7% QoQ and 2.7% YoY in the quarter to June.
Australian Dollar remains below 0.6450 amid bearish bias
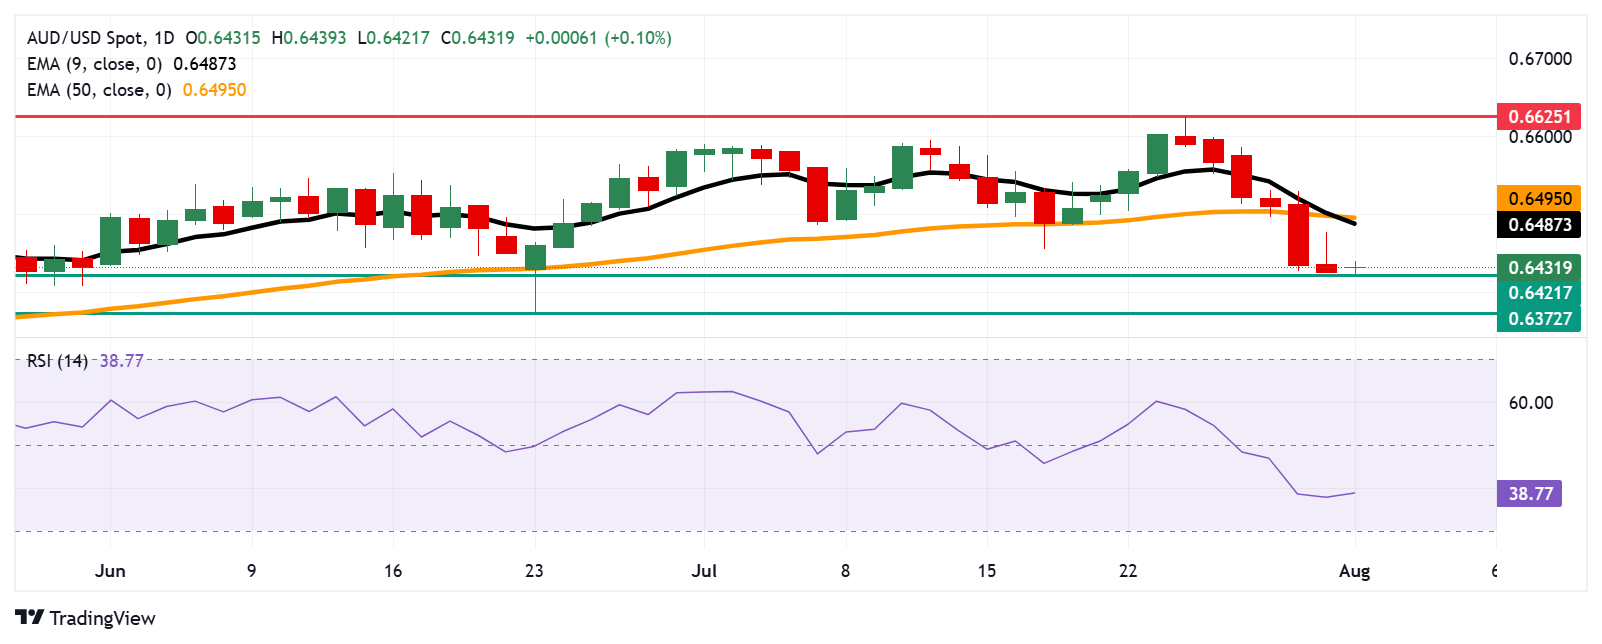
AUD/USD is trading around 0.6430 on Friday. The daily chart’s technical analysis indicates a bearish bias as the 14-day Relative Strength Index (RSI) remains below the 50 mark. Additionally, the pair is positioned below the nine-day Exponential Moving Average (EMA), indicating that short-term price momentum is weaker.
On the downside, the AUD/USD pair could find the primary support at the two-month low of 0.6421, which was recorded on August 1. A break below this level could put downward pressure on the pair to test a three-month low at 0.6372, recorded on June 23.
The AUD/USD pair may target the initial barrier at the nine-day EMA of 0.6487, followed by the 50-day EMA of 0.6495. A break above these levels could strengthen the short- and medium-term price momentum and support the pair to explore the region around the eight-month high at 0.6625.
AUD/USD: Daily Chart
Australian Dollar PRICE Today
The table below shows the percentage change of Australian Dollar (AUD) against listed major currencies today. Australian Dollar was the strongest against the New Zealand Dollar.
| USD | EUR | GBP | JPY | CAD | AUD | NZD | CHF | |
|---|---|---|---|---|---|---|---|---|
| USD | -0.11% | -0.03% | -0.12% | 0.07% | -0.02% | 0.43% | 0.11% | |
| EUR | 0.11% | 0.18% | 0.03% | 0.25% | 0.22% | 0.39% | 0.28% | |
| GBP | 0.03% | -0.18% | -0.14% | 0.07% | 0.04% | 0.43% | 0.11% | |
| JPY | 0.12% | -0.03% | 0.14% | 0.18% | 0.10% | 0.42% | 0.22% | |
| CAD | -0.07% | -0.25% | -0.07% | -0.18% | -0.12% | 0.35% | 0.04% | |
| AUD | 0.02% | -0.22% | -0.04% | -0.10% | 0.12% | 0.39% | 0.20% | |
| NZD | -0.43% | -0.39% | -0.43% | -0.42% | -0.35% | -0.39% | -0.20% | |
| CHF | -0.11% | -0.28% | -0.11% | -0.22% | -0.04% | -0.20% | 0.20% |
The heat map shows percentage changes of major currencies against each other. The base currency is picked from the left column, while the quote currency is picked from the top row. For example, if you pick the Australian Dollar from the left column and move along the horizontal line to the US Dollar, the percentage change displayed in the box will represent AUD (base)/USD (quote).
Economic Indicator
Nonfarm Payrolls
The Nonfarm Payrolls release presents the number of new jobs created in the US during the previous month in all non-agricultural businesses; it is released by the US Bureau of Labor Statistics (BLS). The monthly changes in payrolls can be extremely volatile. The number is also subject to strong reviews, which can also trigger volatility in the Forex board. Generally speaking, a high reading is seen as bullish for the US Dollar (USD), while a low reading is seen as bearish, although previous months’ reviews and the Unemployment Rate are as relevant as the headline figure. The market’s reaction, therefore, depends on how the market assesses all the data contained in the BLS report as a whole.