- GBP/USD trades in negative territory slightly below 1.2900 early Monday.
- The pair’s near-term technical outlook suggests that the bullish bias remains intact.
- The risk-averse market atmosphere could continue to limit GBP/USD’s upside.
After rising more than 2.5% in the previous week, GBP/USD corrects lower and trades below 1.2900 in the European session on Monday. In the absence of high-tier data releases, the pair’s action could remain subdued in the near term.
British Pound PRICE Last 7 days
The table below shows the percentage change of British Pound (GBP) against listed major currencies last 7 days. British Pound was the strongest against the US Dollar.
| USD | EUR | GBP | JPY | CAD | AUD | NZD | CHF | |
|---|---|---|---|---|---|---|---|---|
| USD | -4.04% | -2.35% | -2.21% | -0.47% | -1.68% | -2.25% | -2.70% | |
| EUR | 4.04% | 1.66% | 1.69% | 3.53% | 2.36% | 1.68% | 1.22% | |
| GBP | 2.35% | -1.66% | 0.15% | 1.85% | 0.69% | 0.02% | -0.42% | |
| JPY | 2.21% | -1.69% | -0.15% | 2.02% | 0.61% | 0.03% | -0.48% | |
| CAD | 0.47% | -3.53% | -1.85% | -2.02% | -1.07% | -1.79% | -2.23% | |
| AUD | 1.68% | -2.36% | -0.69% | -0.61% | 1.07% | -0.66% | -1.12% | |
| NZD | 2.25% | -1.68% | -0.02% | -0.03% | 1.79% | 0.66% | -0.45% | |
| CHF | 2.70% | -1.22% | 0.42% | 0.48% | 2.23% | 1.12% | 0.45% |
The heat map shows percentage changes of major currencies against each other. The base currency is picked from the left column, while the quote currency is picked from the top row. For example, if you pick the British Pound from the left column and move along the horizontal line to the US Dollar, the percentage change displayed in the box will represent GBP (base)/USD (quote).
The US Dollar (USD) Index, which tracks the USD’s performance against a basket of six major currencies, lost more than 3% last week, pressured by growing fears over a recession in the US.
Ahead of the weekend, the US Bureau of Labor Statistics reported that Nonfarm Payrolls rose by 151,000 in February, compared to the market expectation of 160,000. The Unemployment Rate edged higher to 4.1% from 4% in January, while the Participation Rate declined to 62.4% from 62.6% in the same period. These figures failed to help the USD rebound. Later in the day, Federal Reserve (Fed) Chairman Jerome Powell said they can maintain policy restraint for longer if inflation progress stalls or that they can ease the policy if the labor market were to weaken unexpectedly. Powell further noted that the uncertainty around the Trump administration’s policies would make it difficult for the Fed to enact policy adjustments.
Later in the session, the Bank of England will release its Quarterly Bulleting for the first quarter. On Wednesday, the US economic calendar will feature Consumer Price Index (CPI) data for February.
Meanwhile, the UK’s FTSE 100 Index was last seen losing about 0.3% on the day and US stock index futures were down between 0.75% and 1%. In case safe-haven flows dominate the action in the financial markets in the second half of the day, GBP/USD could have a hard time regaining its traction.
GBP/USD Technical Analysis
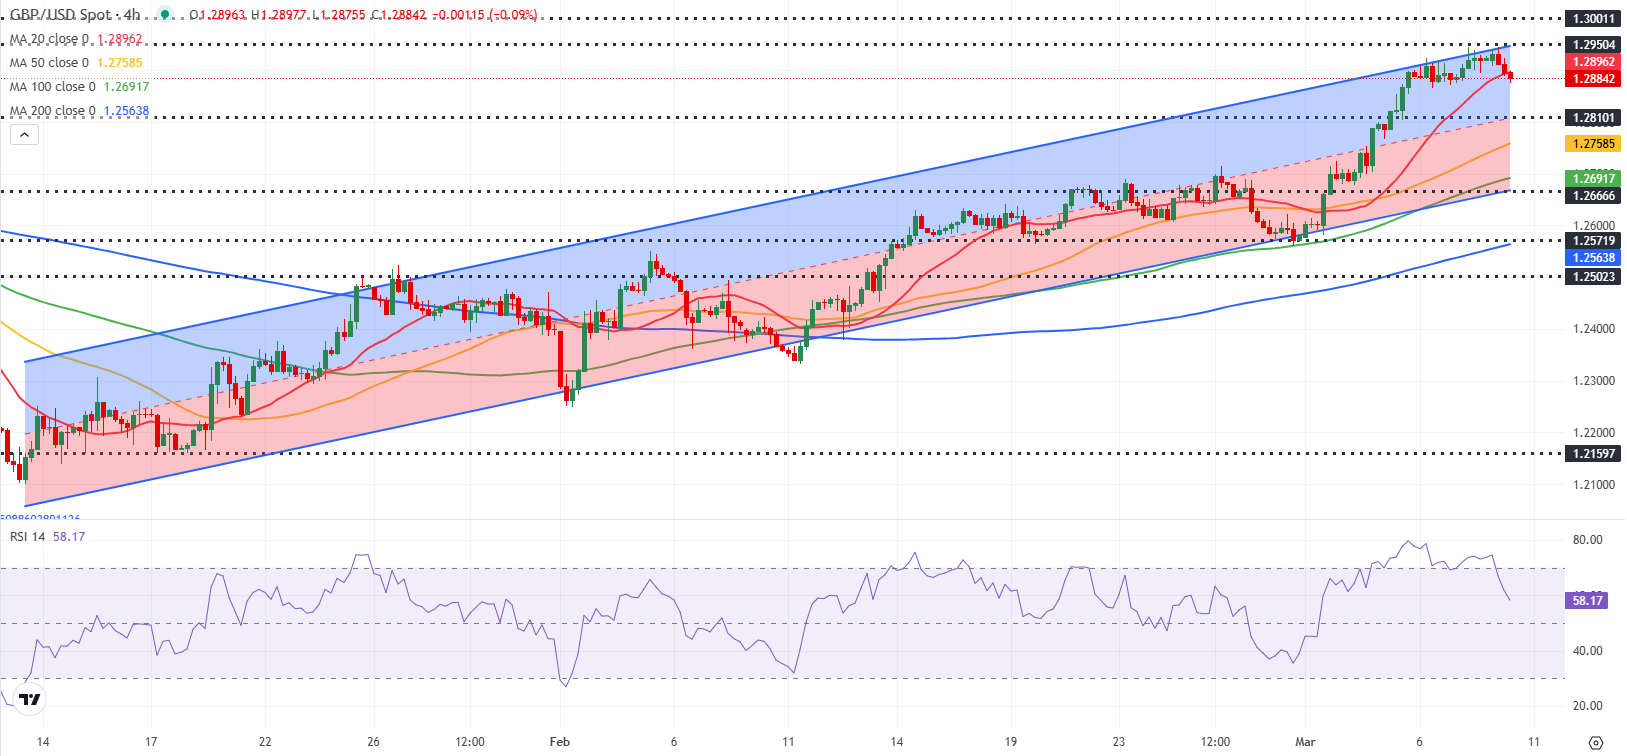
GBP/USD remains within the upper half of the ascending regression channel and the Relative Strength Index (RSI) indicator on the 4-hour chart holds comfortably above 50, suggesting that sellers are yet to commit to a deeper correction.
On the downside, 1.2810-1.2800 (mid-point of the ascending channel, round level) aligns as first support area before 1.2750 (50-day Simple Moving Average (SMA)) and 1.2720 (200-day SMA). Looking north, resistances could be spotted at 1.2950 (upper limit of the ascending channel), 1.3000 (psychological level, static level).
Pound Sterling FAQs
The Pound Sterling (GBP) is the oldest currency in the world (886 AD) and the official currency of the United Kingdom. It is the fourth most traded unit for foreign exchange (FX) in the world, accounting for 12% of all transactions, averaging $630 billion a day, according to 2022 data. Its key trading pairs are GBP/USD, also known as ‘Cable’, which accounts for 11% of FX, GBP/JPY, or the ‘Dragon’ as it is known by traders (3%), and EUR/GBP (2%). The Pound Sterling is issued by the Bank of England (BoE).
The single most important factor influencing the value of the Pound Sterling is monetary policy decided by the Bank of England. The BoE bases its decisions on whether it has achieved its primary goal of “price stability” – a steady inflation rate of around 2%. Its primary tool for achieving this is the adjustment of interest rates. When inflation is too high, the BoE will try to rein it in by raising interest rates, making it more expensive for people and businesses to access credit. This is generally positive for GBP, as higher interest rates make the UK a more attractive place for global investors to park their money. When inflation falls too low it is a sign economic growth is slowing. In this scenario, the BoE will consider lowering interest rates to cheapen credit so businesses will borrow more to invest in growth-generating projects.
Data releases gauge the health of the economy and can impact the value of the Pound Sterling. Indicators such as GDP, Manufacturing and Services PMIs, and employment can all influence the direction of the GBP. A strong economy is good for Sterling. Not only does it attract more foreign investment but it may encourage the BoE to put up interest rates, which will directly strengthen GBP. Otherwise, if economic data is weak, the Pound Sterling is likely to fall.
Another significant data release for the Pound Sterling is the Trade Balance. This indicator measures the difference between what a country earns from its exports and what it spends on imports over a given period. If a country produces highly sought-after exports, its currency will benefit purely from the extra demand created from foreign buyers seeking to purchase these goods. Therefore, a positive net Trade Balance strengthens a currency and vice versa for a negative balance.