- GBP/USD struggles to hold above 1.3300 in the European session on Friday.
- Nonfarm Payrolls in the US are forecast to rise 130,000 in April.
- The pair’s near-term technical outlook suggests that the bearish bias remains intact.
GBP/USD staged a rebound early Friday but failed to stabilize above 1.3300 after posting losses for the third consecutive day on Thursday. The technical outlook points to a bearish bias in the near term as markets gear for the US employment data releases.
British Pound PRICE This week
The table below shows the percentage change of British Pound (GBP) against listed major currencies this week. British Pound was the weakest against the Australian Dollar.
| USD | EUR | GBP | JPY | CAD | AUD | NZD | CHF | |
|---|---|---|---|---|---|---|---|---|
| USD | 0.33% | 0.21% | 0.87% | -0.27% | -0.29% | 0.61% | -0.36% | |
| EUR | -0.33% | -0.17% | 0.54% | -0.61% | -0.72% | 0.27% | -0.71% | |
| GBP | -0.21% | 0.17% | 0.71% | -0.43% | -0.57% | 0.44% | -0.53% | |
| JPY | -0.87% | -0.54% | -0.71% | -1.11% | -1.13% | -1.66% | -0.97% | |
| CAD | 0.27% | 0.61% | 0.43% | 1.11% | -0.15% | 0.88% | -0.08% | |
| AUD | 0.29% | 0.72% | 0.57% | 1.13% | 0.15% | 1.01% | 0.02% | |
| NZD | -0.61% | -0.27% | -0.44% | 1.66% | -0.88% | -1.01% | -0.96% | |
| CHF | 0.36% | 0.71% | 0.53% | 0.97% | 0.08% | -0.02% | 0.96% |
The heat map shows percentage changes of major currencies against each other. The base currency is picked from the left column, while the quote currency is picked from the top row. For example, if you pick the British Pound from the left column and move along the horizontal line to the US Dollar, the percentage change displayed in the box will represent GBP (base)/USD (quote).
The improving risk mood helped the US Dollar (USD) hold its ground on Thursday, causing GBP/USD to continue to push lower. China’s Commerce Ministry stated that they will assess negotiations with the US after the US has taken the initiative to convey that they are willing to talk on trade.
The US Bureau of Labor Statistics will publish the labor market data for April later in the day. Investors expect Nonfarm Payrolls (NFP) to rise 130,000 following the stronger-than-forecast 228,000 increase recorded in March.
A soft NFP reading of 100,000, or lower, could revive fears over an economic downturn and make it difficult for the USD to find demand with the immediate reaction. In this scenario, GBP/USD could gain traction heading into the weekend. On the other hand, an upbeat NFP figure could have the opposite impact on the pair’s action.
Meanwhile, US stock index futures gain between 0.3% and 0.6% in the European session. The USD has been showing a positive correlation with US stocks lately. Hence, a bullish opening in Wall Street, followed by a risk rally, could open the door for another leg lower in GBP/USD.
GBP/USD Technical Analysis
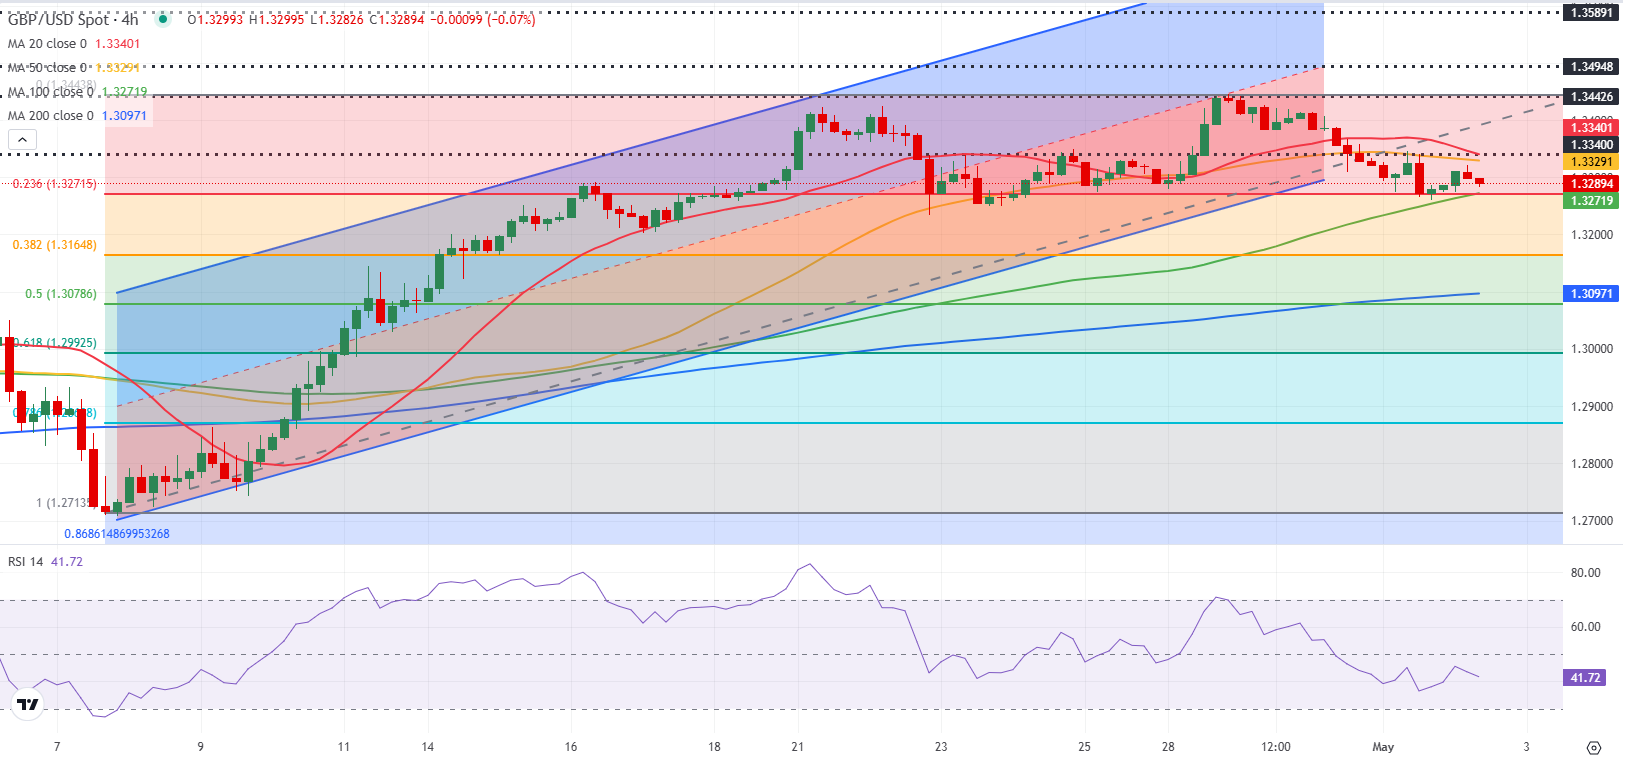
The Relative Strength Index (RSI) indicator on the 4-hour chart stays below 50 and GBP/USD failed to reclaim the 50-period Simple Moving Average (SMA) despite the earlier rebound, reflecting buyers’ hesitancy.
GBP/USD faces a key support level at 1.3270 (Fibonacci 23.6% retracement of the latest uptrend, 100-period SMA) before 1.3200 (static level) and 1.3165 (Fibonacci 38.2% retracement). Looking north, resistances could be seen at 1.3330 (50-period SMA), 1.3400 (round level, static level), 1.3440 (static level).
Nonfarm Payrolls FAQs
Nonfarm Payrolls (NFP) are part of the US Bureau of Labor Statistics monthly jobs report. The Nonfarm Payrolls component specifically measures the change in the number of people employed in the US during the previous month, excluding the farming industry.
The Nonfarm Payrolls figure can influence the decisions of the Federal Reserve by providing a measure of how successfully the Fed is meeting its mandate of fostering full employment and 2% inflation.
A relatively high NFP figure means more people are in employment, earning more money and therefore probably spending more. A relatively low Nonfarm Payrolls’ result, on the either hand, could mean people are struggling to find work.
The Fed will typically raise interest rates to combat high inflation triggered by low unemployment, and lower them to stimulate a stagnant labor market.
Nonfarm Payrolls generally have a positive correlation with the US Dollar. This means when payrolls’ figures come out higher-than-expected the USD tends to rally and vice versa when they are lower.
NFPs influence the US Dollar by virtue of their impact on inflation, monetary policy expectations and interest rates. A higher NFP usually means the Federal Reserve will be more tight in its monetary policy, supporting the USD.
Nonfarm Payrolls are generally negatively-correlated with the price of Gold. This means a higher-than-expected payrolls’ figure will have a depressing effect on the Gold price and vice versa.
Higher NFP generally has a positive effect on the value of the USD, and like most major commodities Gold is priced in US Dollars. If the USD gains in value, therefore, it requires less Dollars to buy an ounce of Gold.
Also, higher interest rates (typically helped higher NFPs) also lessen the attractiveness of Gold as an investment compared to staying in cash, where the money will at least earn interest.
Nonfarm Payrolls is only one component within a bigger jobs report and it can be overshadowed by the other components.
At times, when NFP come out higher-than-forecast, but the Average Weekly Earnings is lower than expected, the market has ignored the potentially inflationary effect of the headline result and interpreted the fall in earnings as deflationary.
The Participation Rate and the Average Weekly Hours components can also influence the market reaction, but only in seldom events like the “Great Resignation” or the Global Financial Crisis.