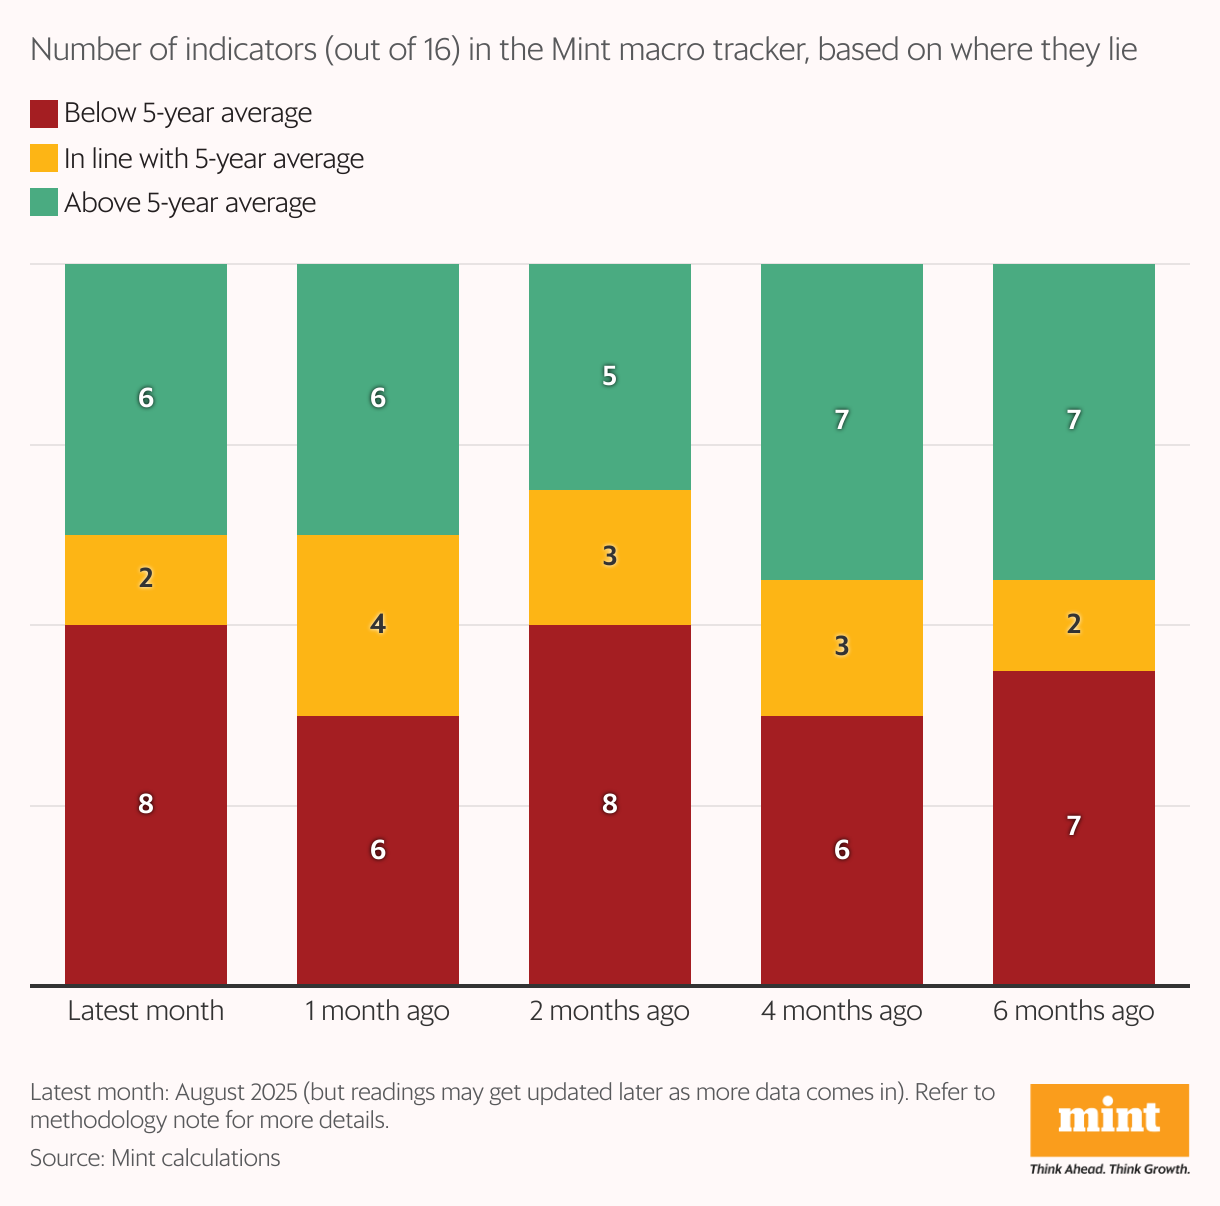
The Indian economy’s performance deteriorated in August, with eight out of 16 indicators in the red, compared to six the previous month, as risks from US tariffs weighed on performance of the rupee and labour-intensive exports, according the 16-high frequency indicators tracked by Mint in its monthly macro tracker.
At the same time, six indicators remained in the green—unchanged from the previous month—as the ease of living sector continued to remain strong, aided by low inflation. Consumer and producer segments continued to show mixed trends, with robust tractor sales and manufacturing and services activities emerging as bright spots.
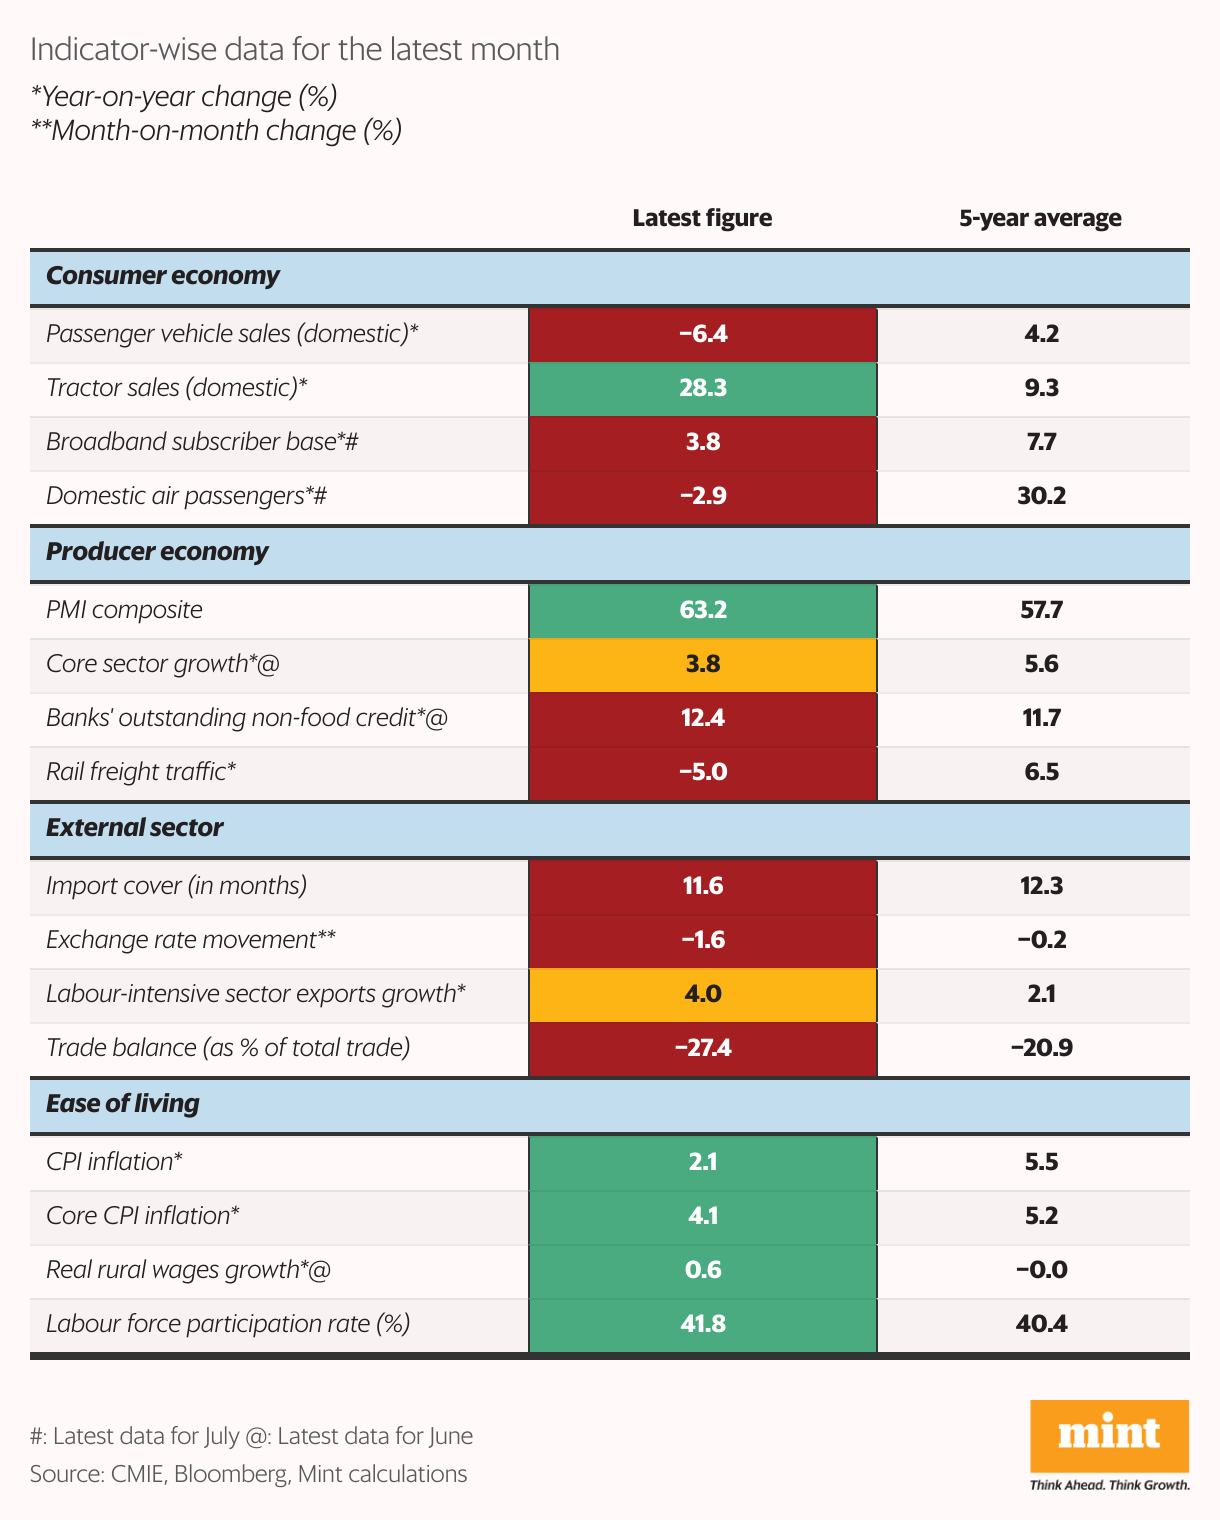
For each indicator, the value in each month is assigned a colour coding (red, amber and green) to denote where it lies relative to the five-year average (red denotes worse, amber denotes it is in line with the average range, and green denotes better).
Apart from weaker rupee and slower labour-intensive exports, India’s import cover also deteriorated and overall trade balance remained in the red zone.
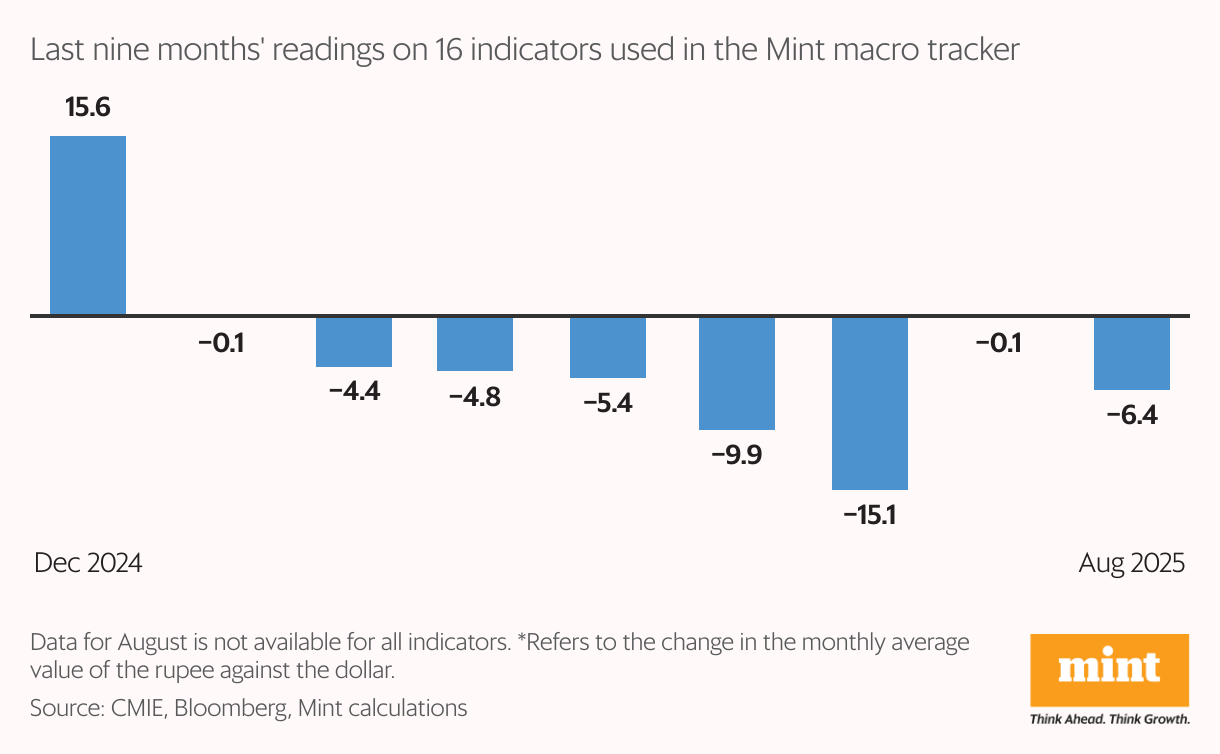
Mint macro tracker, which provides a monthly comprehensive report on the state of the economy, based on trends in 16 high-frequency indicators. The tracker has been running since October 2018.
Methodology note: While calculating the five-year average, data for some indicators for April-May 2020 and April-May 2021 have been removed to eliminate lockdown-induced skews in the trend. However, the five-year averages may still show high figures due to sustained base effect in several indicators in 2021 and 2022.
Monthly standings will get updated retrospectively as more data comes in.
For inflation, the red/green coding is reversed.