Yet policy flip-flops and global disruptions triggered by President Donald Trump’s second term could shake the rupee-dollar market almost as profoundly as that 1991 reset, 35 years ago.
On an average, the rupee has depreciated by about 3-4% against the dollar each year, with occasional depreciation spikes during periods of crisis. Before Trump came back to power, in 2024, the rupee saw a steady 1.3% depreciation, though it was partially stabilized by RBI intervention.
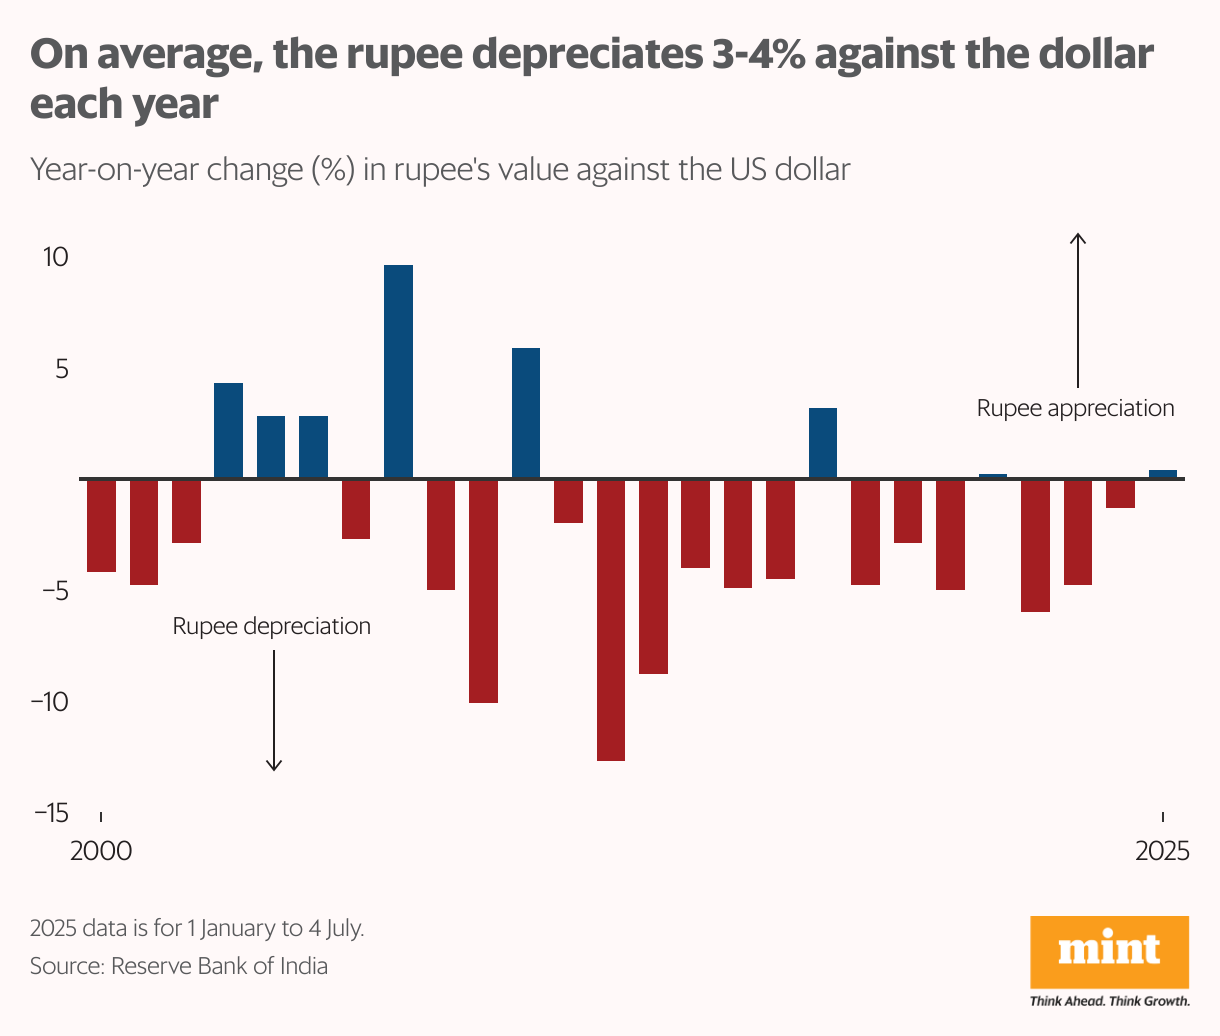
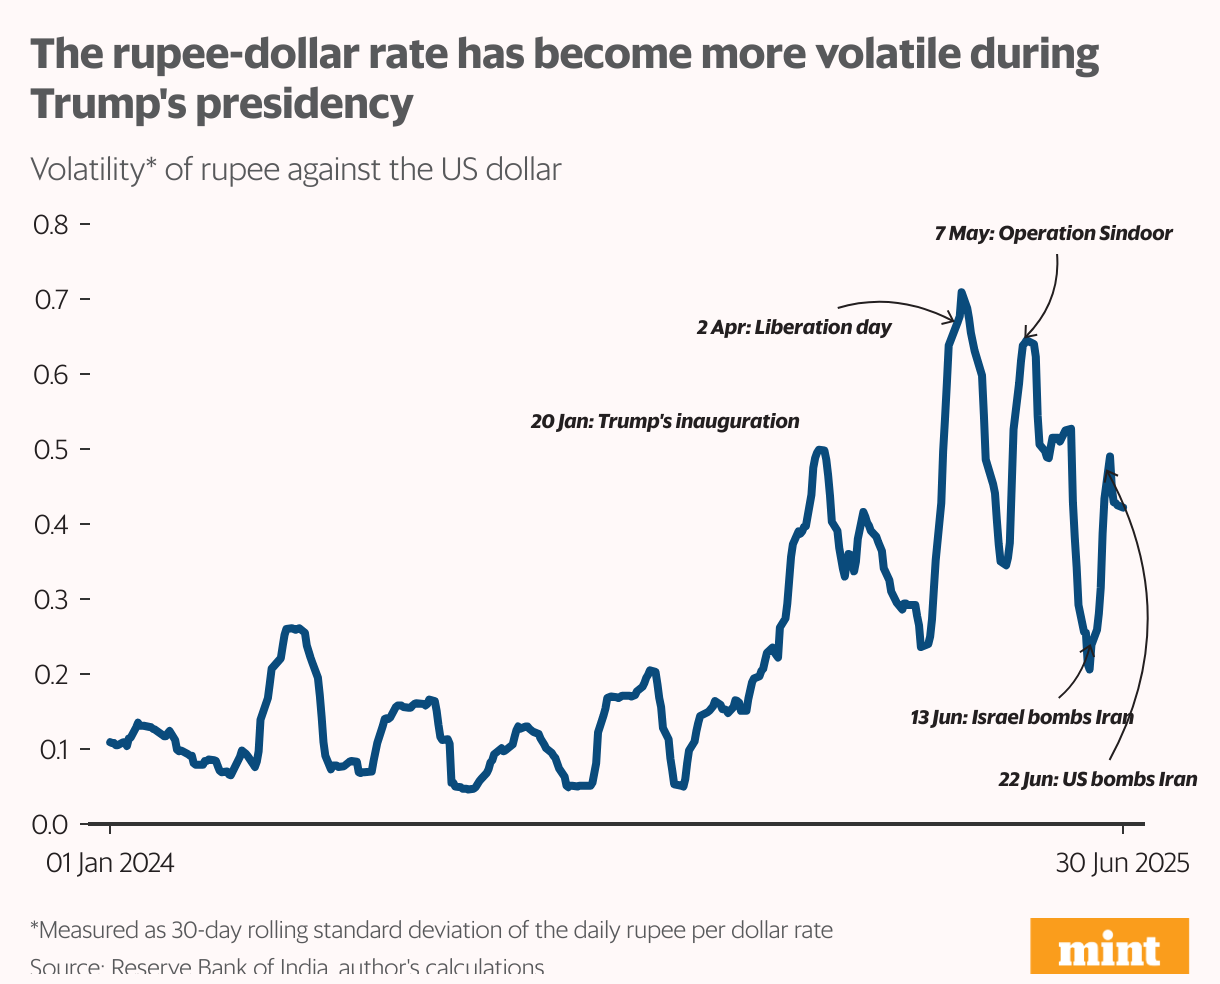
In 2025, the rupee has swung both ways—depreciating in some months and appreciating in others—resulting in a modest 0.4% gain so far. But with a US-India trade deal under discussion, the RBI may now intervene more cautiously, wary of being labelled a currency manipulator. Meanwhile, a barrage of announcements from the Trump administration has heightened uncertainty and volatility in the rupee-dollar exchange, threatening India’s trade and capital flow outlook.
Economic theory tells us that the rupee-dollar exchange rate depends on interest rate differentials and inflation differences; indeed, these variables play a key role. But on a day-to-day basis, the rupee is affected more by factors that directly and immediately impact the demand and supply of dollars, such as crude oil prices, foreign portfolio flows, and uncertainty about economic policies.
Crude cushion
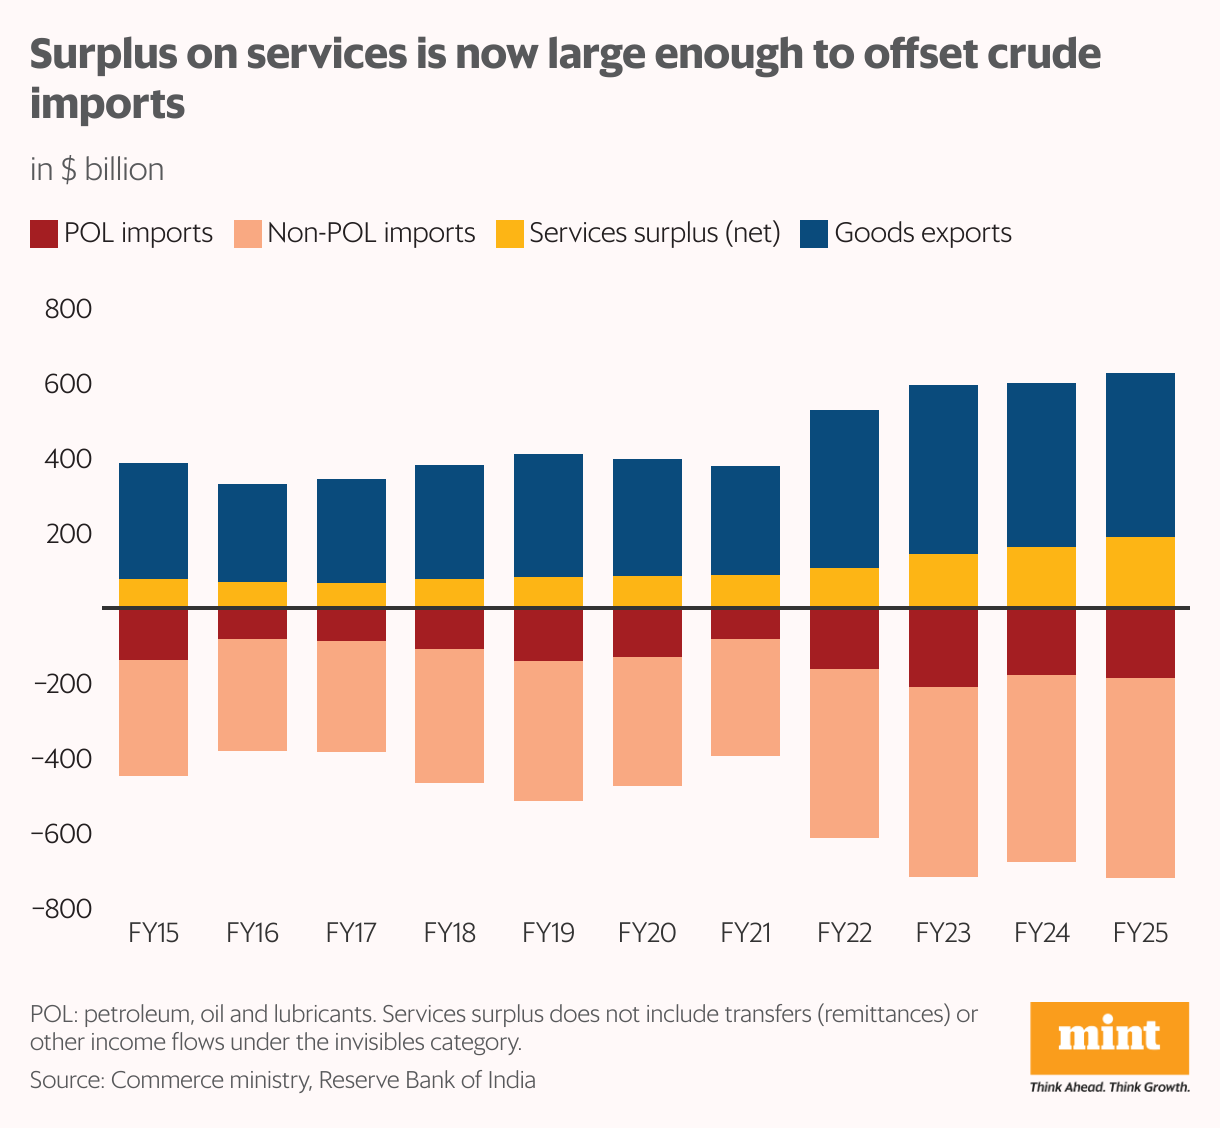
India imports 85-88% of its crude oil requirements; petroleum, oil and lubricants (POL) make up a quarter of its import bill.
When crude prices go up, the rupee weakens because the higher cost of importing crude increases the demand for dollars. The rupee’s sensitivity to crude prices cannot be changed. However, India has managed to change its crude dependence in two ways. One, more diversified import sources have made us less dependent on one country or region. Historically, crude imports were dominated by West Asia and the Gulf region; now, Russia and the US are important suppliers. In addition, the government is said to be exploring geographies in Latin America and Africa to further de-risk the supply chain.
Two, rising service exports provide a dollar cushion to set off the cost of crude imports. For the first time in 2024-25, the net surplus on services was higher than the crude import bill. The lesson? We cannot control crude prices, but boosting exports can make crude imports more affordable.
Portfolio flows
In general, foreign portfolio inflows (FPI) strengthen the rupee, and outflows weaken it.
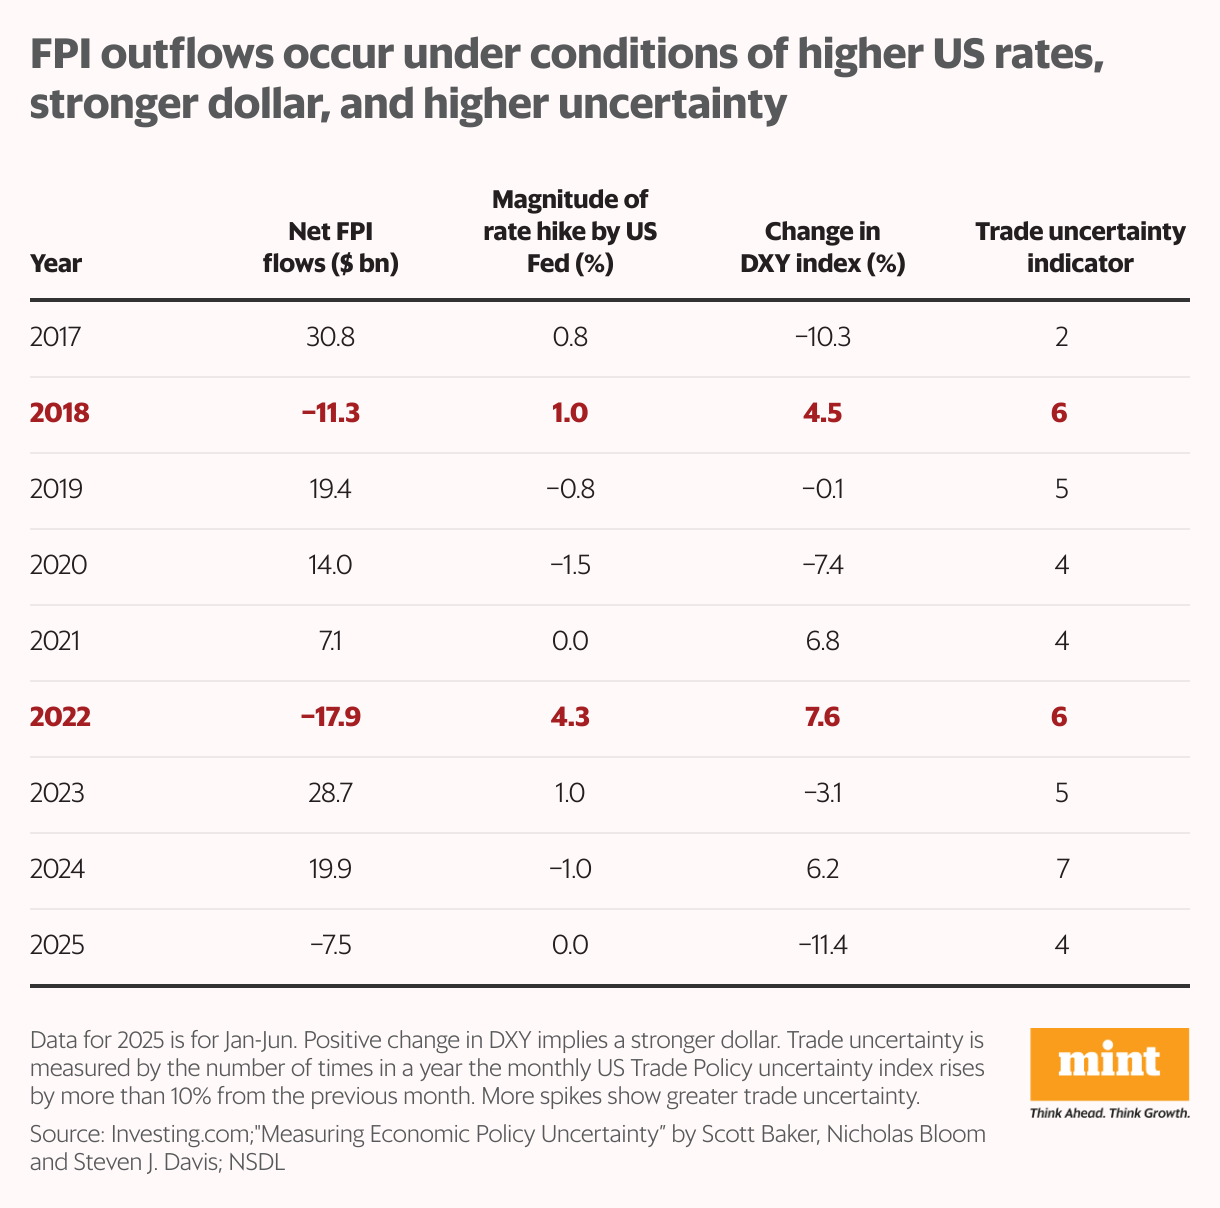
The most recent episodes of net FPI outflows occurred in 2018 and 2022. These years had three common features. One, rate hikes by the US Federal Reserve, which led to rising US interest rates, and made Indian assets relatively less attractive. Two, a strengthening dollar, which reduced the dollar return on Indian investments. Three, a rise in trade uncertainty, which put India’s current account at risk and exposed the rupee to the risk of depreciation.
Data suggests that when all three conditions are present, FPIs are likely to become risk-off and pull out from Indian markets.
The Trump administration’s reset of global trade and finance has already shaken investor confidence, resulting in a net FPI outflow of $7.5 billion during January-June 2025.
Yet not all signals are negative: the dollar has weakened, and the US Fed is expected to hold interest rates, both positives for India-bound capital.
Dollar policy
President Trump wants a lower trade deficit; a competitive real exchange rate would have helped by boosting exports.
Unfortunately, the real exchange rate of the dollar has been trending up for over a decade. It is approaching the highs of 1971 and 1985— years in which dollar overvaluation peaked, and policy steps were required to weaken the dollar. In 1971, President Nixon suspended the dollar’s convertibility into gold, thereby initiating the current dollar-based global system (Nixon shock). The 1985 Plaza Accord forced G5 nations to intervene collectively to depreciate the dollar.
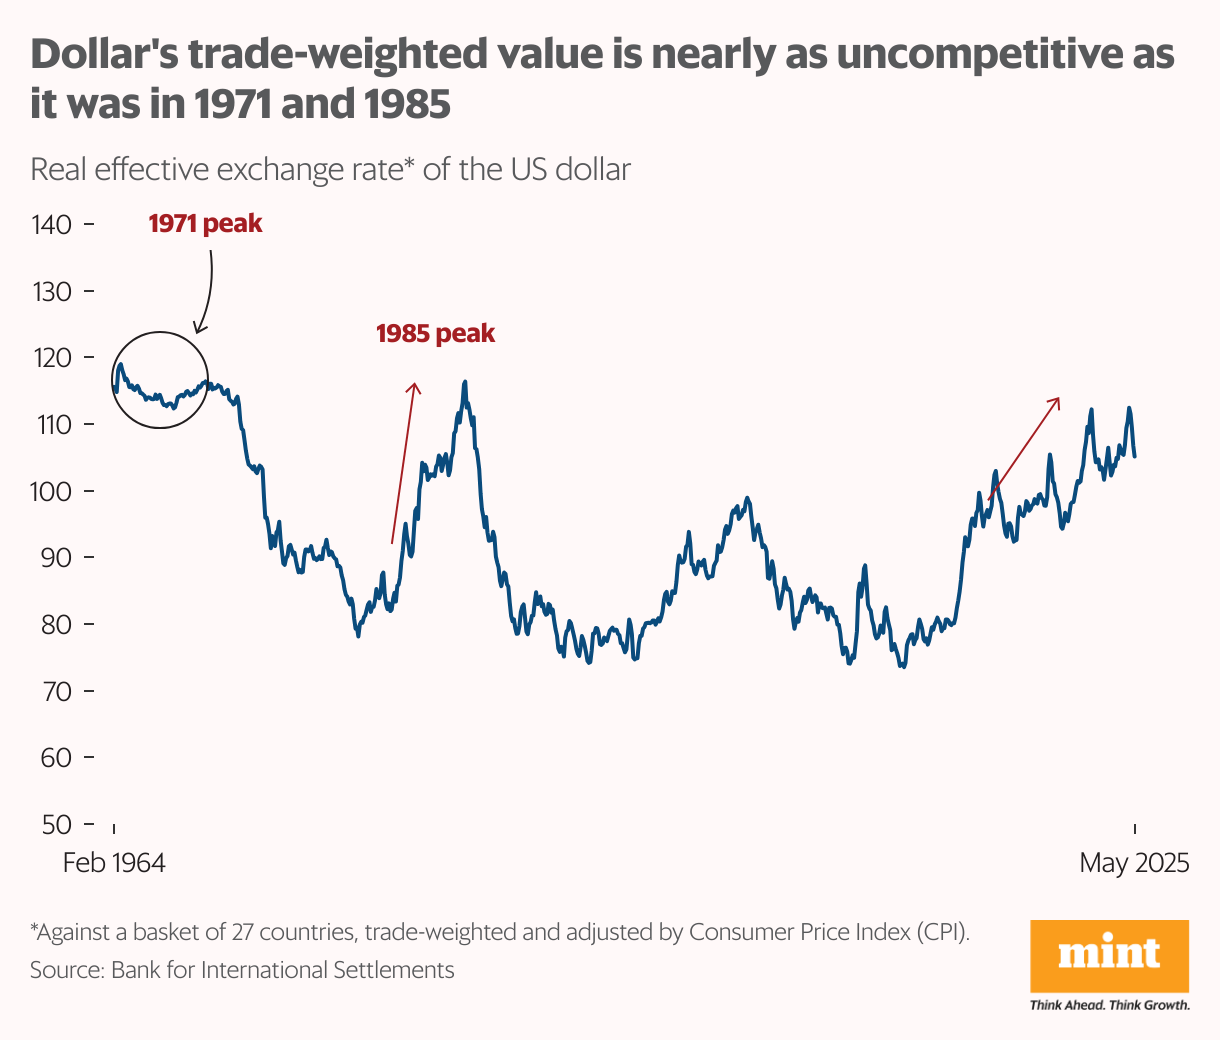
So far, there is no indication that the US will take policy action to weaken the dollar. But the dollar has already lost 11% in the first six months of 2025—the result of rising US debt and policy uncertainty.
As Trump’s July 9 tariff deadline approaches, it’s becoming increasingly clear: policy uncertainty, not traditional macro fundamentals, may end up driving the rupee’s trajectory in the months ahead.
The author is an independent writer in economics and finance.