In recent days, the Indian rupee’s exchange rate against the dollar has again made headlines. More often than not, the primary reason for weakness in rupee’s exchange rate has been India’s trade deficit (in other words, the fact that India imports more than it exports) and India’s current account deficit. More simply, more money (read dollars) was flowing out of India than coming in.
But there was always a flip-side to this story: India, thanks to growth potential, also received a lot of foreign investments — either in the form of Foreign Direct Investment (FDI, or investing money into things like building a new factory in India) or in the shape of Foreign Portfolio Investments (FPI, or investing money in the form of buying stocks and shares of company). Historically, the “surplus” on this count — called the Capital Account — papered over the “deficit” on the trade or current account.
To conceptually understand all about these types of flows and understand how rupee’s exchange rate is connected with trade deficit or with the current account deficit, read this edition of ExplainSpeaking.
This edition of GDP is focussed on highlighting how “net” foreign investments in India have taken a beating, and thus contributing to rupee’s weakness. In other words, how the net money flowing into India via this route of financial investments — as against the trade route — has been falling. The use of the word “net” implies that once all the money coming in and going out of India is taken together.
Let’s first look at what has happened to FDI coming into India. In CHART 1, the green line shows the money coming into India as FDI and the red line shows the money going out of India (that is, the FDI for foreign countries).
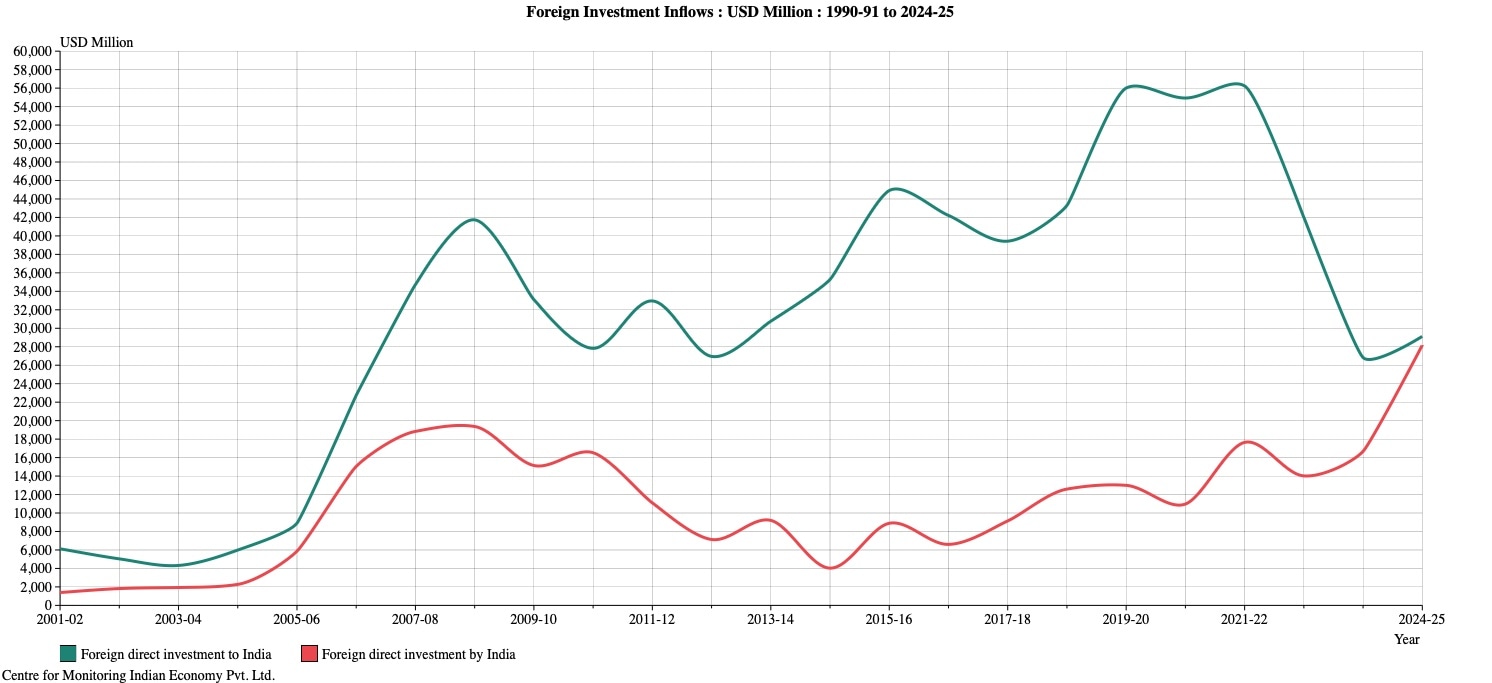 CHART 1
As the chart shows, since 2021-22, the green line has plummetted even as the red line has surged. In other words, while foreigners are holding back investing in India via the FDI route. This is critical problem because the FDI route is preferred over the FPI route; investments through the FDI route show that a foreign investor is really committed to staying invested in India for the long term. This data is only up to March 2025.
CHART 2 shows what has happened in the current financial year. The story is pretty much the same. The green line is falling and has been overtaken by the red line — Indian investments abroad are more than foreign FDI into India. This is exactly the opposite of the Swadeshi call in many ways.
Story continues below this ad
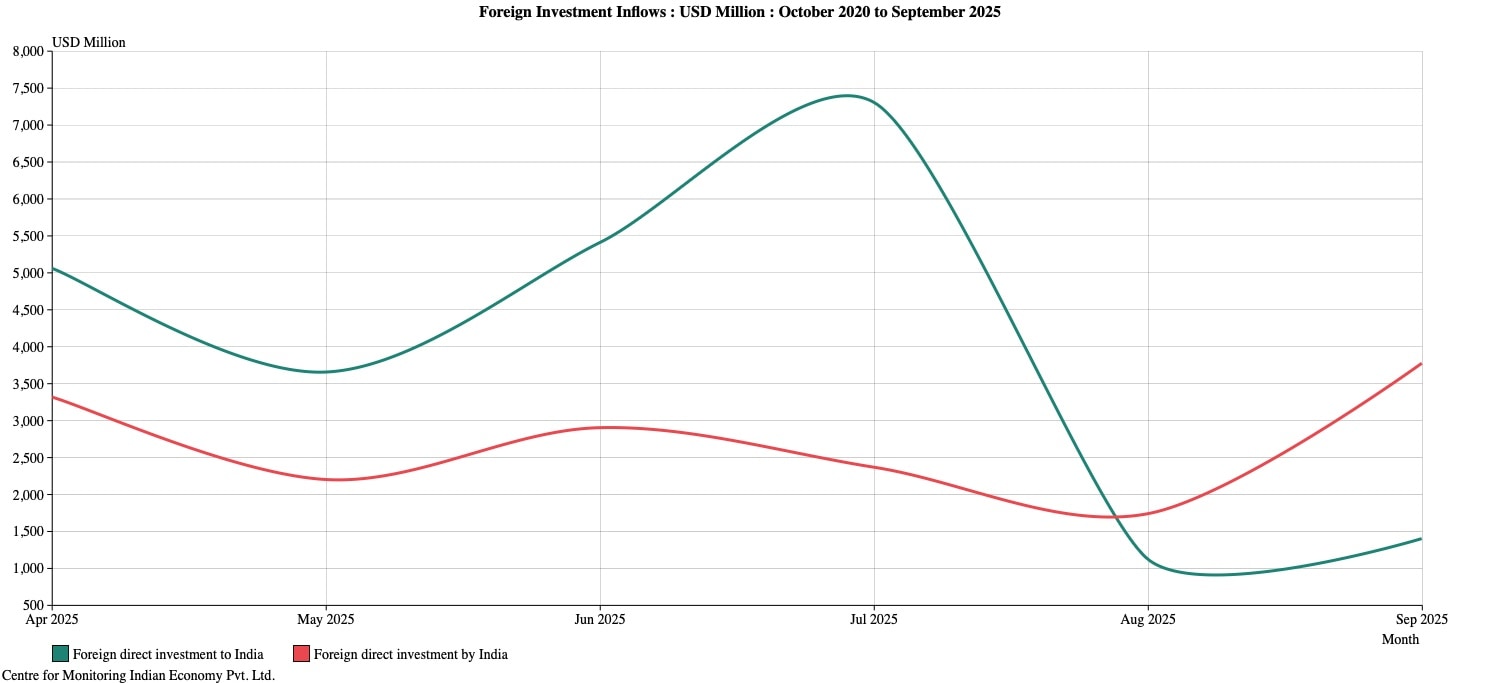 CHART 2
What is the “net” result? CHART 3 shows that precisely. The “net” FDI into have fallen towards the zero level. The story is the same if one looks at the data in the current financial year.
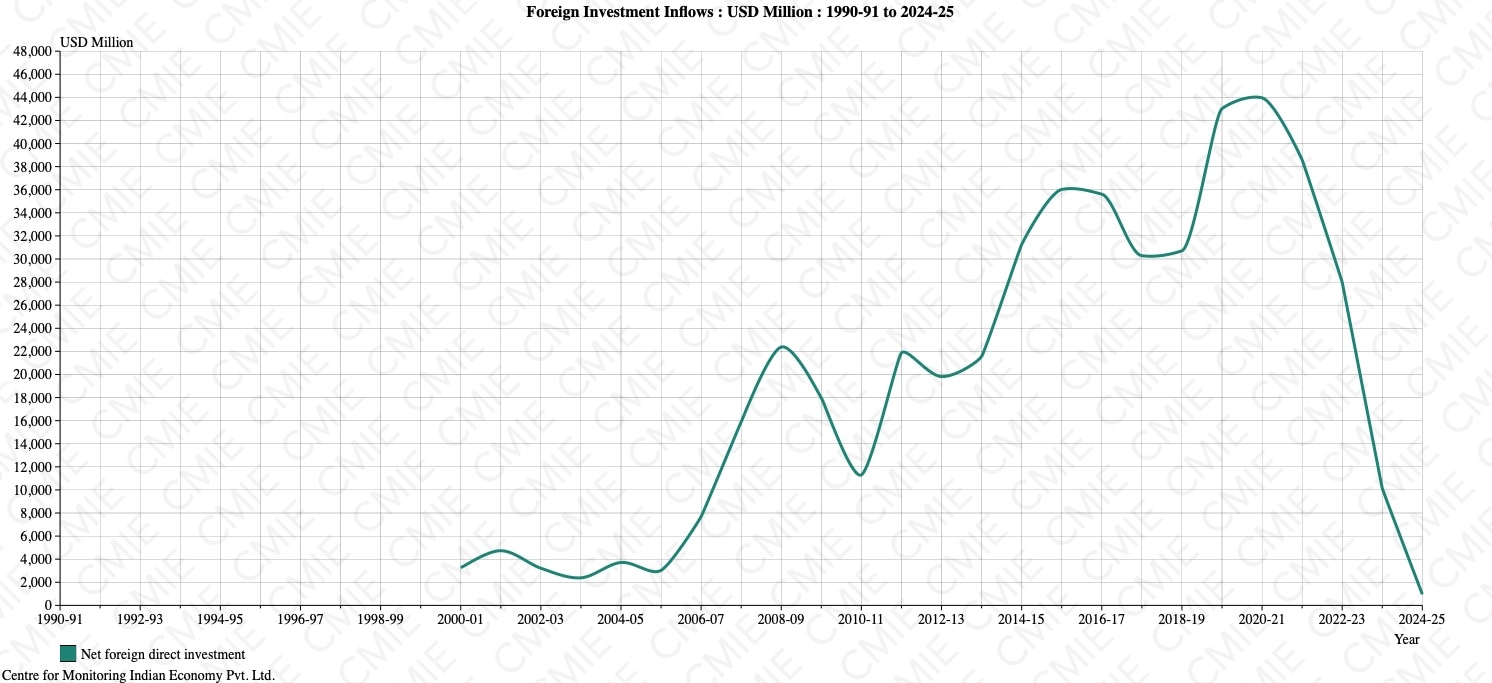 CHART 3
But this is still only the FDI bit. There is also the FPI investments that India receives. CHART 4 maps the net FPIs and it yet again shows how they are negative. That mean again, more money has been invested by Indians in stocks and share abroad than by foreigners into Indian stock markets.
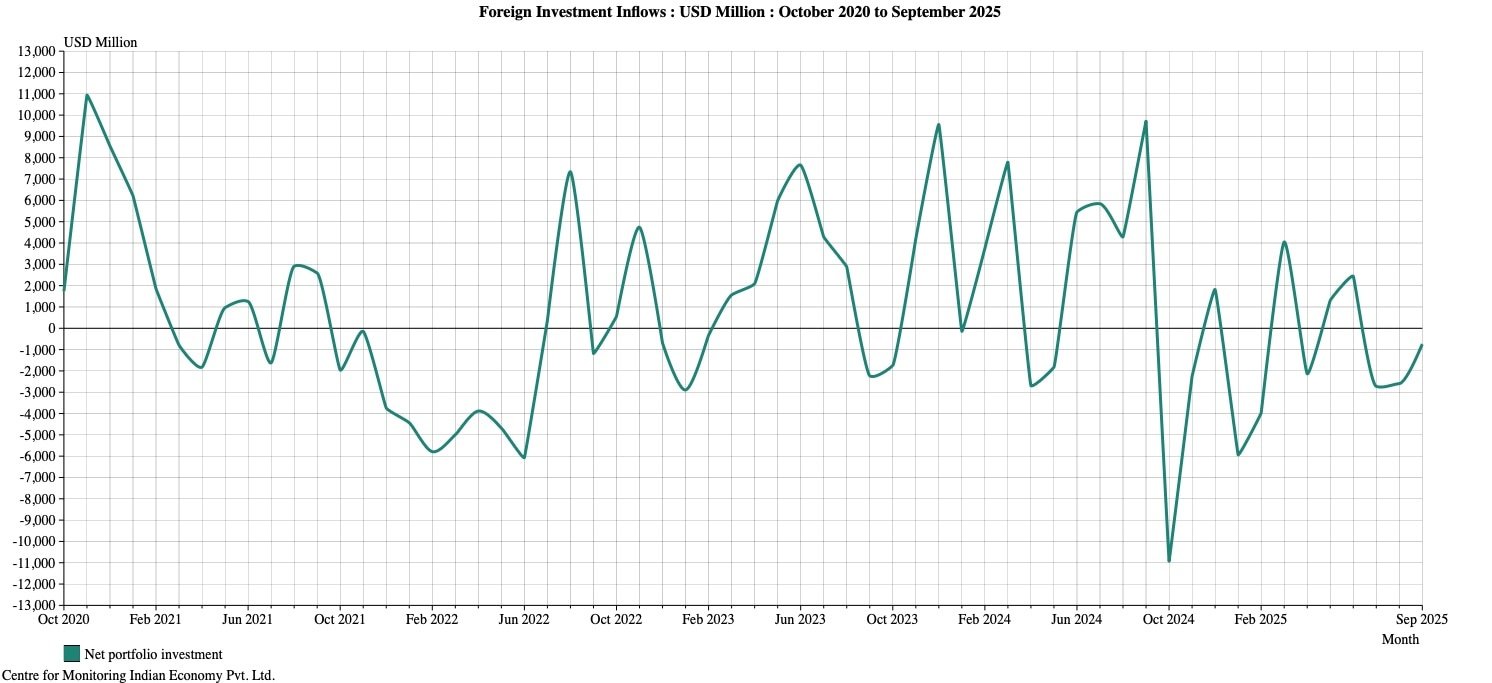 CHART 4
When more money goes out of India than what comes in, the rupee’s exchange rate fall or weakens because it essentially means that the US dollars are more in demand relative to Indian rupee.
The trend is counter-intuitive: Indian Indian economy is growing much faster than all the comparable economies then presumably the Indian companies would also be doing very well and, by extension, foreign invetsors should be making a beeline to invest in India in every shape or form. Or could it be that the GDP growth rate data is overstating India’s economic momentum?