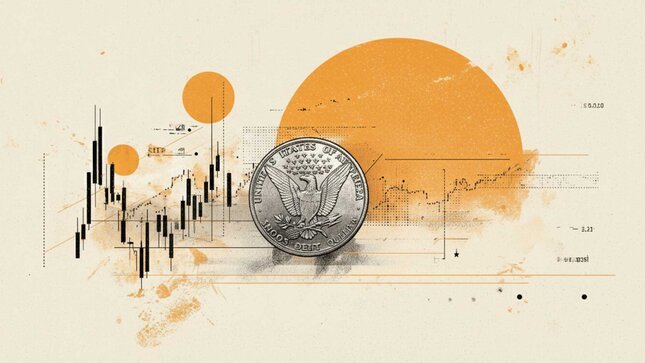



US Dollar/Canadian Dollar weekly candlestick chart. Source: TradingView.
US Data Continues to Dominate
US data continues to be the driving force behind USD/CAD, as evidenced by the trend seen in the January payroll report. Non-farm payrolls rose 130,000 in January versus 55,000 expected, and the unemployment rate fell to 4.3% (down from 4.4% in December). Additionally, year-over-year wage growth was reported at 3.7%. This set of numbers gave the Fed no reason to move up their timeline for an action, which is why USD responded positively to the news.
A Different Side of the USD Story
The January CPI report, however, showed a different side of the USD story. Headline inflation was at 2.4%, down from 2.7% last month and below the 2.5% consensus forecast. Core CPI was at 2.5%, marking the first time the Core CPI has dropped below this level since April 2021. While this data could eventually lead to weak demand and weaken USD, one data point is not sufficient to change market expectations. The Fed has been clear that they require continued progress before taking action. As such, the markets added slightly to June cut expectations, but sentiment remains subdued.
Uncertainty in Tariff Policy
Uncertainty Surrounding Tariffs
There is still uncertainty surrounding tariffs, as well as continual confusion over this policy decision by the recently passed US Congress. On a partisan basis, the US House of Representatives voted 219 to 211 last week to attempt to repeal President Trump’s imposition of his 25% tariffs on Canadian imports, which is a rare act of bipartisan criticism of the President’s trade policies. Six Republicans voted with the Democrats to overturn the tariffs; however, the resolution must now go before the US Senate, where similar legislation has already been passed. Despite this fact, the likely outcome is that the President will veto this latest congressional attempt to remove the tariffs and therefore no change will result on tariffs until at least 2027 at the earliest.
Economic Impact of These Tariffs
Analysts are putting together their forecasts for the economic impact of these tariffs over our planning horizon to 2027, and most are estimating that these tariffs will reduce Canadian GDP by 1.2% between now and 2026. We are also starting to see the impact of the tariffs on manufacturing data, which will be continuing over the next several months as the international community re-evaluates their economic relationship with Canada.
Furthermore, President Trump has stated that he will impose an additional 100% tariff on all Canadian imports if Canada proceeds with a trade agreement with China. This increases the uncertainty of doing business with and/or trading with Canada. Finally, most Canadian banks are indicating that the Comprehensive Trade Agreement is a wildcard in determining the value of the Canadian dollar against the US dollar, because trade news releases can move the value of the USD/CAD without taking into account the underlying fundamentals.
Oil Provides a Floor, Not a Catalyst
As of February, WTI Crude has settled between $62 and $64. The steady prices have negated against any major sell offs in the CAD; however, momentum should be generated by other sources rather than energy alone. The descriptive term for oil according to an institution in the market, currently, would be “a floor” not necessarily “a catalyst”. If, in the next couple of months or years an example where oil has broken above any resistance is witnessed, the market will determine if CAD relative value increases. Nevertheless, at this time, according to EIA, 2026 estimates for average Brent are $58 per barrel therefore suggesting no immediate increase in value of the Canadian Dollar based on commodity related increases.
The Signal to Watch
The Bond Yield Spread Provides an Indication
The most important sign for where the USD/CAD will go, is the difference between the two-year yields on bonds in the US and Canada. The bond yield spread provides an indication of what each central bank’s monetary policies are expected to be. In the past, these have proven to be very good forecasters of future currency movement. Right now, US yields are much higher than Canada’s therefore funds are being drawn toward US assets. A significant reduction in the yield spread will occur when either softer US economic data pushes expectations for a Fed rate cut forward OR when an increase in expected future interest rates from the Bank of Canada increases Canadian yields. This would be a catalyst for a continued downward move in USD/CAD.
Near-Term Outlook
Based on an analysis of the current institutional landscape, I would characterize the probability distribution of an eventual gradual decline in the USD/CAD exchange rate from between 1.32 to 1.35 through 2026 at 50% – 60%, with the balance of the overall institutional probability (~25% – 30%) for a range bound series of oscillations over that same time span.