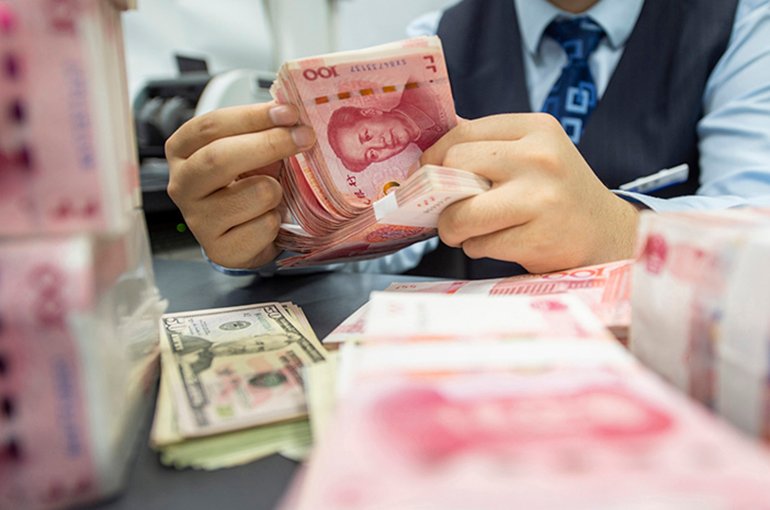
The combination of the US economy’s large twin deficits – both fiscal and current account – and elevated asset valuations would normally act as a brake on dollar strength. Yet the currency’s multi-year rally has defied expectations.
Today, however, there are signs1 that a weaker dollar may be a key priority for the US administration as it seeks to increase the competitiveness of US production. As the scales begin to tip on the greenback, a depreciation appears likely, and that’s highly relevant for investors in the EM (emerging market) debt asset class.
The strong dollar: a dominant driver of asset returns
The US dollar appears to be partway through its third cycle of the past 50 years. From the start of this cycle in 2011 to the end of 2024, it strengthened by over 40 per cent on a trade-weighted basis – rising from undervalued levels during the euro-crisis to what most would agree to be very extended.
During this period, foreign investors who left their US dollar exposure unhedged enjoyed an additional tailwind: the currency’s appreciation amplified the already strong returns generated by US assets. For over a decade – through an extended period of US ‘exceptionalism’ – European and Asian investors benefitted from this currency boost on their US investments.
However, for those investing in EM debt, the past decade has been painful. During the previous US dollar cycle, the weakening phase that began in 2003 boosted EM local-currency debt returns, but since 2011 the dollar’s relentless rise has had the opposite effect (Figure 1).
Figure 1. The US dollar cycles of the past 50 years2

Source: Bloomberg, JPMorgan, as at April 2025. EM local currency debt market = JPMorgan GBI-EM Global Diversified unhedged. *Returns annualised from 31 Dec 2002 to 31Dec 2011. 31 Dec 2002 used as this is the inception date of the index. **Returns annualised from 31Dec 2011 to 30 April 2025.
How overvalued has the dollar become?
Much like in earlier periods of extended dollar strength, the currency’s continued appreciation has contributed to global economic imbalances – including a marked decline in the competitiveness of US manufacturing. This came into focus in President Trump’s first term and now appears to be reaching a tipping point.
One simple way to illustrate the imbalance is by comparing GDP measured in nominal US dollars with GDP in purchasing-power-parity (PPP) terms, which adjust for differences in local prices and cost of living between countries. On this basis, US GDP is roughly $30tn in both measures, while China’s rises from about $20tn in dollar terms to $40tn in PPP terms – implying goods and investments cost roughly half as much to produce in China. India’s divergence is even starker: its PPP-based GDP is around four times higher than its nominal value.3
Across emerging markets, PPP-based GDP averages around 2.4 times higher than dollar-based GDP, underscoring the extent of current valuation disparities. Even among developed markets outside the US, the divergence has widened sharply: 15 years ago, among developed markets including Germany and Japan, the US was one of the cheapest places to produce goods – today, it is one of the most expensive (Figure 2).
While structural drivers such as productivity and industrial policy also affect relative costs, the dollar’s strength remains a very significant contributor to the widening competitiveness gap between the US and the rest of the world.
Figure 2: GDP in PPP terms relative to GDP in US dollars, compared to the trade-weighted dollar
Developed markets

Emerging markets

Source: IMF, US Federal Reserve, Ninety One calculations. As of April 2025.
A possible tipping point
Tracking the ratio of PPP-based to US dollar-based GDP over time reveals two things.
Firstly, the relative cost of goods and services across developed and emerging markets tends to move with the value of the US dollar – an expected outcome, since exchange rates influence relative pricing. The ‘Big Mac’ index, for example, illustrates this point, where the pricing of Big Macs across countries (measured in US dollars) is driven by two variables: the cost of the inputs (thus the local price of the burger) and the relative value of the currencies.
The second observation is today’s ratios of PPP-based to US dollar-based GDP are at their highest levels in nearly 25 years, echoing the dollar peak in 2001–2002, which preceded a sharp correction.4 In fact, considering developed markets only, the ratios are at the highest levels since the early 1980s, when extreme dollar strength led to Reagan’s Plaza Accord of 1985.
History suggests another turn in the US dollar cycle may be approaching.
The impact of a weaker dollar
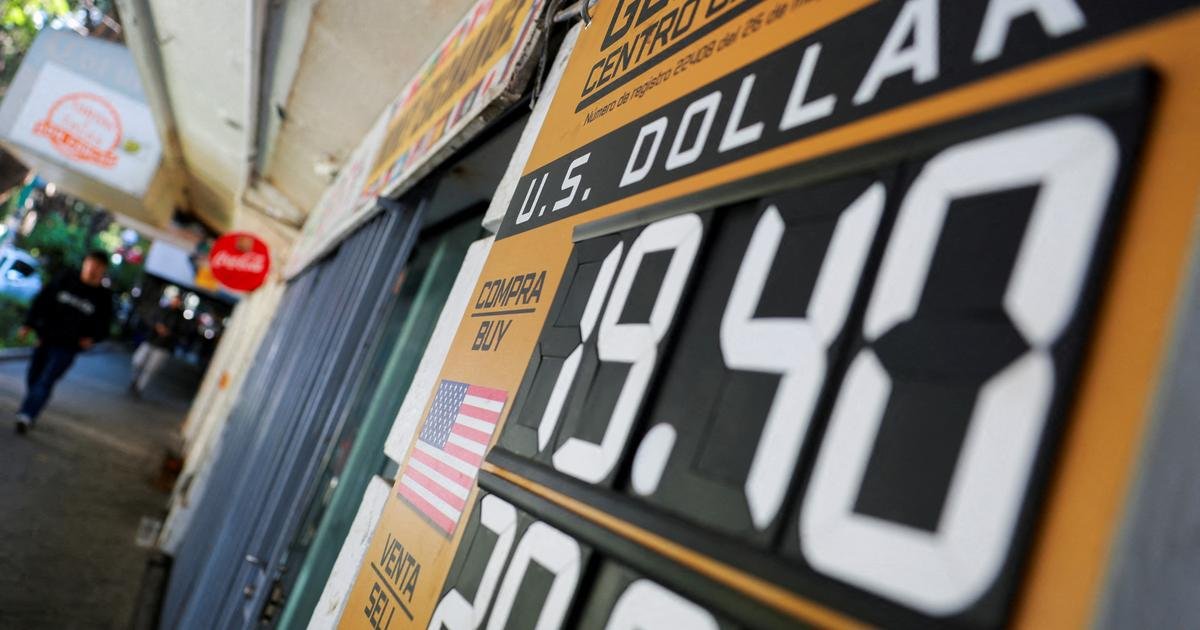
While a stronger dollar has strained smaller emerging markets with dollar-denominated debt, it has tended to support exports from larger EM economies by improving their relative cost competitiveness. Some developed regions, including Europe, also benefitted at the margin as the dollar outpaced most major currencies.
Given this backdrop, some experts suggest the current US administration5 may be comfortable with a softer dollar – or at least stronger currencies among major trading partners – as a way to help rebalance trade competitiveness of the US. But unwinding this loss in competitiveness will not be easy. Production cost gaps between the US and EMs exceed twofold, reflecting not just the currency effects, but structurally lower wages and cost of living in EMs.
Closing that gap could require a sharp – and potentially destabilising – devaluation. But a 20–30 per cent dollar decline over time could perhaps restore some competitiveness against other developed markets, particularly Europe and Japan. A dollar depreciation of this magnitude would be tolerable for large EM economies and even beneficial for smaller, more indebted ones.
Looking ahead: implications for investors in EM debt
A weaker dollar could prove a meaningful tailwind for EM debt, particularly local-currency bonds. Since the end of 2011, the asset class has underperformed as the dollar’s extended rally and associated EM currency depreciation wiped out much of the yield the asset class had offered.
With local-currency bond yields now nearly 6 per cent,6 even a modest dollar decline could deliver notable upside. Investors could earn a healthy income relative to developed-market bonds while also benefitting from potential currency gains.
1 Source: See various reports around a potential ‘Mar-a-Lago Accord’
2 Source: This chart plots the US dollar real effective exchange rate (REER). We use the REER instead of DXY because the latter is heavily skewed to a few developed economies, while the former, weighted to actual trade volumes with the US, better reflects changing global economic patterns. Moreover, DXY is a nominal index that does not adjust for inflation differences between countries, whereas a real index adjusts for inflation differentials over time, showing the evolution of the real purchasing power of the US dollar
3 Source: IMF World Economic Outlook Database, October 2024
4 Source: Ninety One, The Unstoppable Dollar Meets the Immovable Mr Trump, July 2025
5 Source: hks.harvard.edu/centers/mrcbg/programs/growthpolicy/trumps-misguided-plan-weaken-dollar
6 Source: JPMorgan GBI-EM Global Diversified Index, as at 30 September 2025

Grant Webster
Portfolio Manager, Ninety One