- The Euro is under renewed bearish pressure after Monday’s sharp reversal from 0.8670.
- A bearish engulfing candle on the daily chart highlights the growing negative momentum.
- EUR/GBP supports are at 0.8620, and at the key area around the 0.8600 level.
The Euro posted a significant reversal from the 0.8670 area on Monday, printing a bearish engulfing candle on the daily chart. This figure has strongly negative connotations and has shifted the pair’s focus towards the key support area around 0.8600.
The fundamental background is not particularly supportive of the Euro. News that the French Prime Minister, Francois Bayrou, might be missing support to apply sweeping budget cuts has raised concerns about political stability in the heart of the Union. Meanwhile, Trump’s threat of hiking tariffs on countries applying any sort of digital tax is targeted at the EU.
Technical Analysis: Near the bottom of a Wedge Pattern
Recent price action shows that the EUR/GBP is trading within an expanding wedge, a pattern that highlights an irrational market often appearing near significant tops.
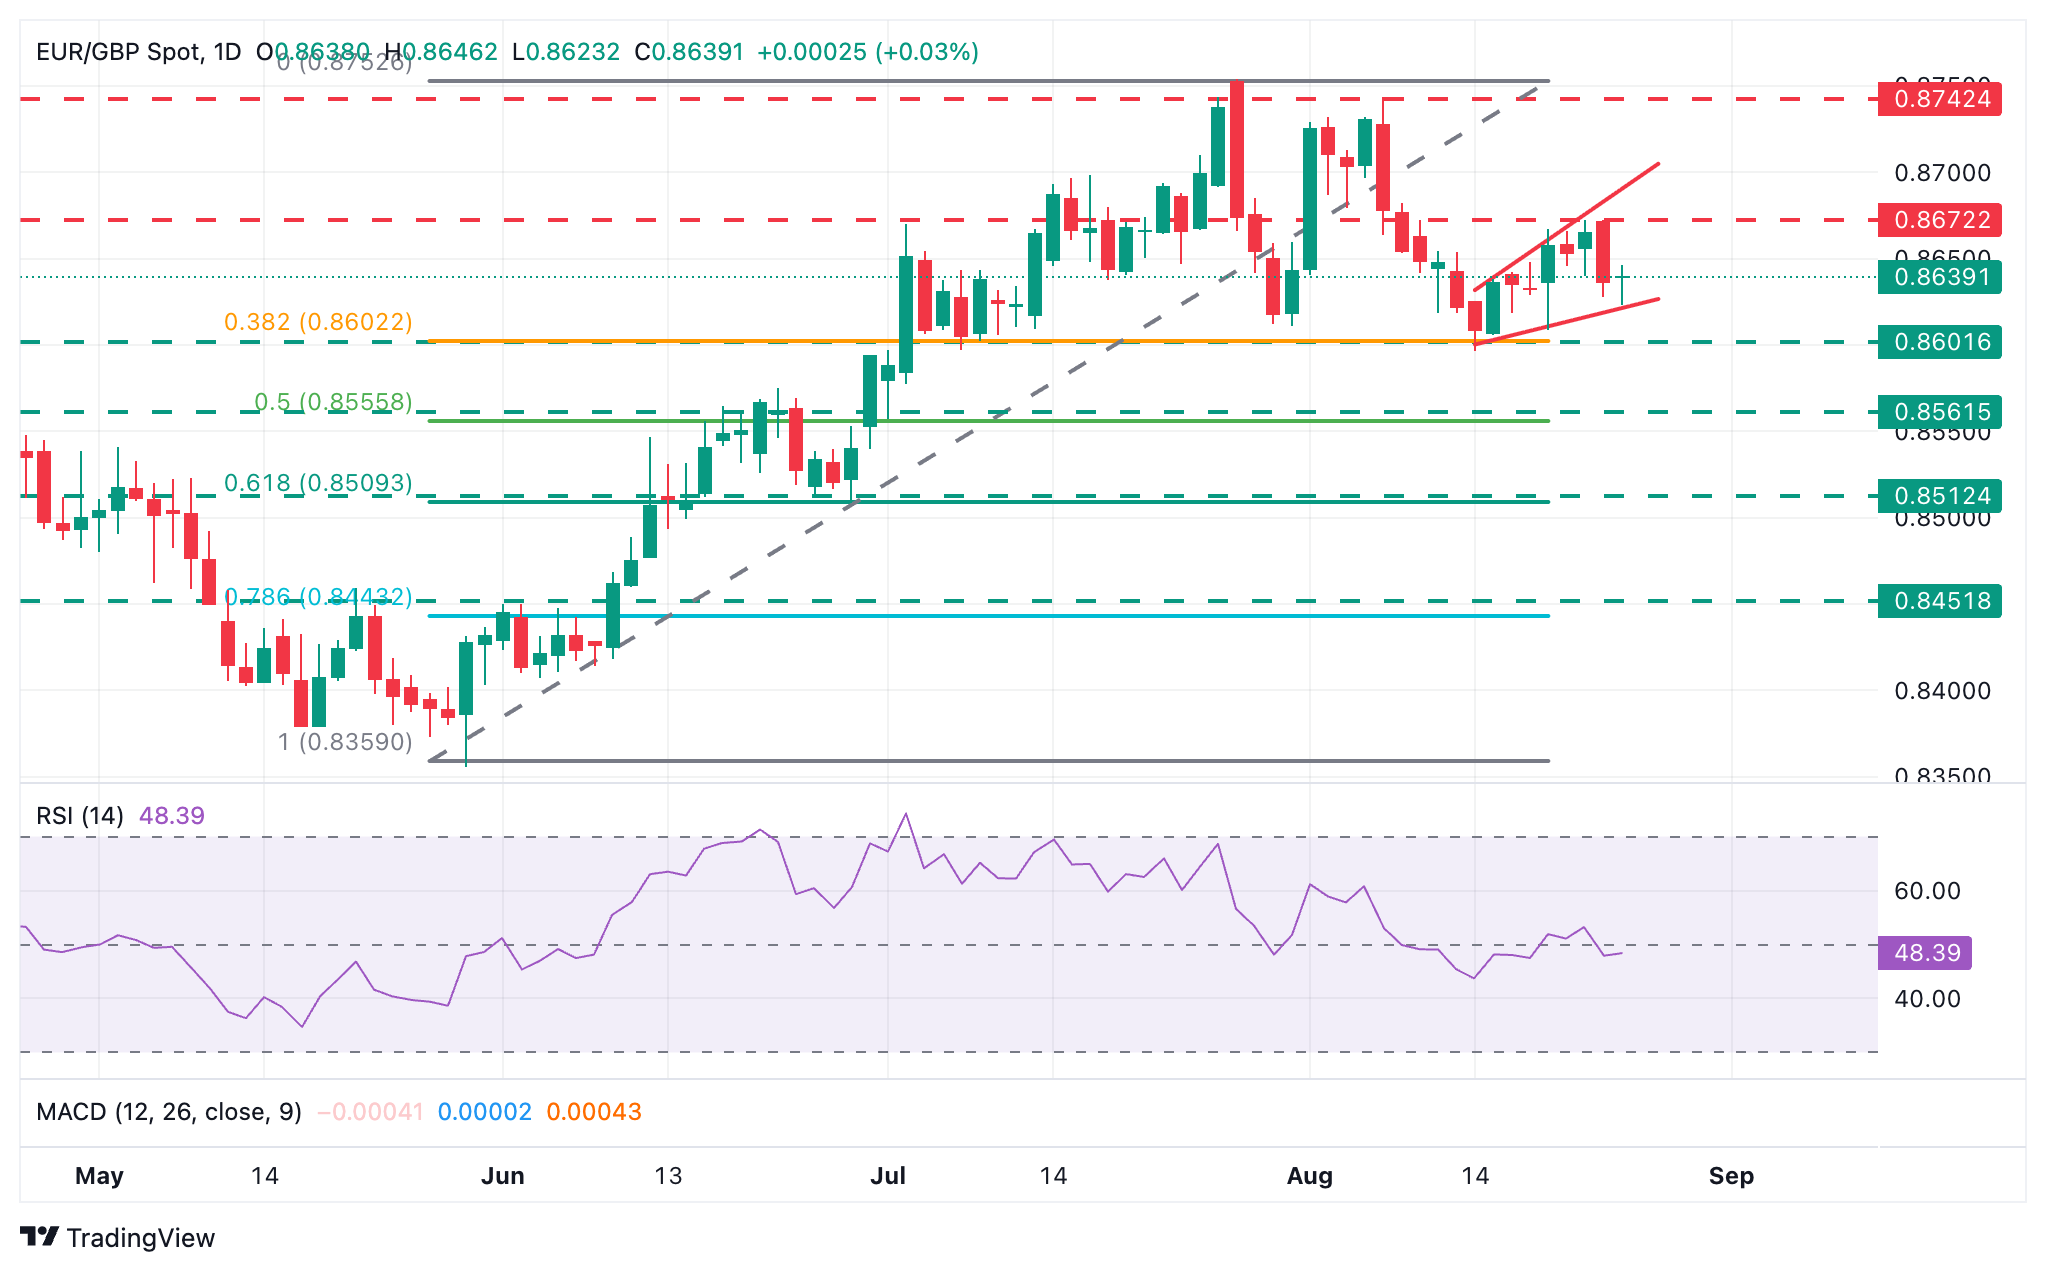
This, coupled with a potential double top at the 0.8740-0.8750 area, suggests that the Euro might be about to extend its correction from the May- July rally.
The wedge bottom, now around 0.8620, is closing the path to the support area between 0.8595 and 0.8610, which capped downside attempts in July and August. Below here, bears would be back in charge, aiming for the July 1 low, at 0.8555.
To the upside, Monday’s impulsive reaction from the 0.8670 area reveals an important resistance at those levels. Further up, the wedge top is now around 0.9700. Further up, the mentioned 0.8740-0.8750 (July 28, August 7 high) will come to the forefront.
Euro Price Today
The table below shows the percentage change of Euro (EUR) against listed major currencies today. Euro was the strongest against the New Zealand Dollar.
| USD | EUR | GBP | JPY | CAD | AUD | NZD | CHF | |
|---|---|---|---|---|---|---|---|---|
| USD | -0.26% | -0.28% | -0.28% | -0.11% | -0.15% | -0.13% | 0.00% | |
| EUR | 0.26% | 0.05% | 0.07% | 0.16% | 0.17% | 0.36% | 0.29% | |
| GBP | 0.28% | -0.05% | 0.02% | 0.13% | 0.17% | 0.32% | 0.25% | |
| JPY | 0.28% | -0.07% | -0.02% | 0.13% | 0.03% | 0.34% | 0.10% | |
| CAD | 0.11% | -0.16% | -0.13% | -0.13% | -0.03% | 0.18% | -0.03% | |
| AUD | 0.15% | -0.17% | -0.17% | -0.03% | 0.03% | 0.01% | -0.01% | |
| NZD | 0.13% | -0.36% | -0.32% | -0.34% | -0.18% | -0.01% | -0.07% | |
| CHF | -0.00% | -0.29% | -0.25% | -0.10% | 0.03% | 0.01% | 0.07% |
The heat map shows percentage changes of major currencies against each other. The base currency is picked from the left column, while the quote currency is picked from the top row. For example, if you pick the Euro from the left column and move along the horizontal line to the US Dollar, the percentage change displayed in the box will represent EUR (base)/USD (quote).