
- GBP/USD trades in a narrow band above 1.3250 on Monday.
- GBP/USD snapped a six-day losing streak after weak US jobs data on Friday.
- The technical outlook doesn’t yet hint at a bullish reversal.
GBP/USD finds it difficult to attract bulls in the European session on Monday and fluctuates below 1.3300. The pair’s near-term technical outlook doesn’t yet offer any convincing signs of a bullish reversal.
British Pound PRICE Last 7 days
The table below shows the percentage change of British Pound (GBP) against listed major currencies last 7 days. British Pound was the weakest against the Japanese Yen.
| USD | EUR | GBP | JPY | CAD | AUD | NZD | CHF | |
|---|---|---|---|---|---|---|---|---|
| USD | 1.71% | 1.13% | 0.07% | 0.53% | 1.50% | 1.75% | 1.49% | |
| EUR | -1.71% | -0.60% | -1.57% | -1.16% | -0.20% | 0.04% | -0.22% | |
| GBP | -1.13% | 0.60% | -1.16% | -0.56% | 0.40% | 0.65% | 0.38% | |
| JPY | -0.07% | 1.57% | 1.16% | 0.46% | 1.37% | 1.65% | 1.54% | |
| CAD | -0.53% | 1.16% | 0.56% | -0.46% | 0.93% | 1.22% | 0.95% | |
| AUD | -1.50% | 0.20% | -0.40% | -1.37% | -0.93% | 0.24% | -0.02% | |
| NZD | -1.75% | -0.04% | -0.65% | -1.65% | -1.22% | -0.24% | -0.26% | |
| CHF | -1.49% | 0.22% | -0.38% | -1.54% | -0.95% | 0.02% | 0.26% |
The heat map shows percentage changes of major currencies against each other. The base currency is picked from the left column, while the quote currency is picked from the top row. For example, if you pick the British Pound from the left column and move along the horizontal line to the US Dollar, the percentage change displayed in the box will represent GBP (base)/USD (quote).
The broad-based selling pressure surrounding the US Dollar (USD) helped GBP/USD gain traction and allowed the pair to snap a six-day losing streak.
The monthly data published by the US Bureau of Labor Statistics (BLS) showed that Nonfarm Payrolls (NFP) rose by 73,000 in July, missing analysts’ estimate of 110,000, while the Unemployment Rate edged higher to 4.2% from 4.1%, as expected. More importantly, the BLS announced that it revised down May and June NFP increases, noting that NFP growth in this two-month period combined was 258,000 lower than previously reported.
The probability of a 25 basis points Federal Reserve (Fed) rate cut in September jumped above 70% from about 30% before the data, as per CME FedWatch Tool. In turn, the USD weakened sharply against its peers.
The economic calendar will not feature any high-tier macroeconomic data releases on Monday. Later in the week, the Bank of England (BoE) will announce monetary policy decisions.
In the meantime, market participants will keep a close eye on US politics. Following the dismal employment report, US President Donald Trump fired BLS Chief Erika McEntarfer, accusing her of manipulating the numbers for political purposes. Additionally, Fed Governor Adriana Kugler, whose term was scheduled to end on January 31, 2026, announced her resignation.
Investors could opt to stay away from the USD in case political developments feed into concerns over the Fed or the BLS losing independence.
GBP/USD Technical Analysis
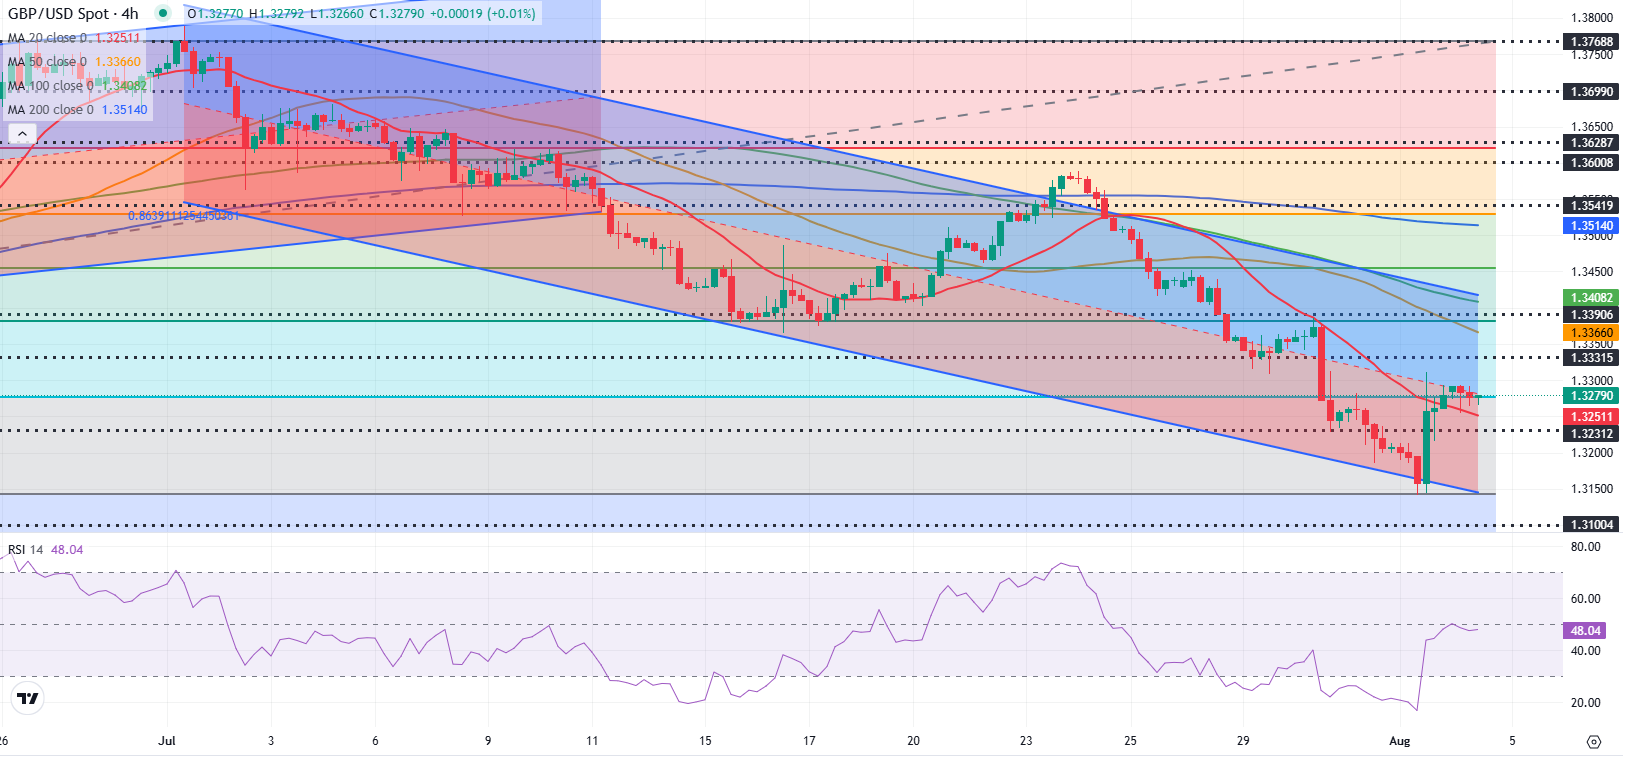
The Relative Strength Index (RSI) indicator on the 4-hour chart stays below 50 and GBP/USD remains within the one-month-old descending regression channel, suggesting that the bearish bias remains intact following Friday’s rebound.
On the downside, the 20-period Simple Moving Average (SMA) aligns as interim support at 1.3250 ahead of 1.3200 (static level, round level) and 1.3140 (lower limit of the descending channel).
Looking north, resistance levels could be spotted at 1.3300 (static level, round level), 1.3330 (former support level) and 1.3370 (50-period SMA).
Pound Sterling FAQs
The Pound Sterling (GBP) is the oldest currency in the world (886 AD) and the official currency of the United Kingdom. It is the fourth most traded unit for foreign exchange (FX) in the world, accounting for 12% of all transactions, averaging $630 billion a day, according to 2022 data.
Its key trading pairs are GBP/USD, also known as ‘Cable’, which accounts for 11% of FX, GBP/JPY, or the ‘Dragon’ as it is known by traders (3%), and EUR/GBP (2%). The Pound Sterling is issued by the Bank of England (BoE).
The single most important factor influencing the value of the Pound Sterling is monetary policy decided by the Bank of England. The BoE bases its decisions on whether it has achieved its primary goal of “price stability” – a steady inflation rate of around 2%. Its primary tool for achieving this is the adjustment of interest rates.
When inflation is too high, the BoE will try to rein it in by raising interest rates, making it more expensive for people and businesses to access credit. This is generally positive for GBP, as higher interest rates make the UK a more attractive place for global investors to park their money.
When inflation falls too low it is a sign economic growth is slowing. In this scenario, the BoE will consider lowering interest rates to cheapen credit so businesses will borrow more to invest in growth-generating projects.
Data releases gauge the health of the economy and can impact the value of the Pound Sterling. Indicators such as GDP, Manufacturing and Services PMIs, and employment can all influence the direction of the GBP.
A strong economy is good for Sterling. Not only does it attract more foreign investment but it may encourage the BoE to put up interest rates, which will directly strengthen GBP. Otherwise, if economic data is weak, the Pound Sterling is likely to fall.
Another significant data release for the Pound Sterling is the Trade Balance. This indicator measures the difference between what a country earns from its exports and what it spends on imports over a given period.
If a country produces highly sought-after exports, its currency will benefit purely from the extra demand created from foreign buyers seeking to purchase these goods. Therefore, a positive net Trade Balance strengthens a currency and vice versa for a negative balance.