Key Highlights
- GBP/USD started a fresh decline below the 1.3120 support zone.
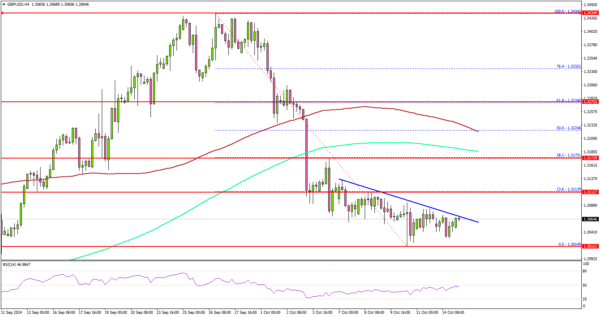
- A connecting bearish trend line is forming with resistance at 1.3070 on the 4-hour chart.
- EUR/USD extended losses and traded below the 1.0920 support.
- Bitcoin rallied above the $63,500 and $64,000 levels.
GBP/USD Technical Analysis
The British Pound started a fresh decline from the 1.3440 resistance against the US Dollar. GBP/USD traded below the 1.3250 and 1.3120 support levels to enter a bearish zone.
Looking at the 4-hour chart, the pair settled below the 1.3100 level, the 100 simple moving average (red, 4-hour), and the 200 simple moving average (green, 4-hour). The pair even tested the 1.3015 zone. A low was formed at 1.3014 and the pair is now consolidating losses.
On the downside, immediate support sits near the 1.3020 level. The next key support sits near the 1.3000 level. Any more losses could send the pair toward the 1.2880 level.
On the upside, the bears might be active near the 1.3070 level. There is also a connecting bearish trend line forming with resistance at 1.3070 on the same chart. The first major resistance might be near the 1.3120 level. It is close to the 23.6% Fib retracement level of the downward move from the 1.3434 swing high to the 1.3014 low.
A close above the 1.3120 level could set the tone for another increase. The next major resistance could be 1.3175. A clear move above the 1.3175 level might send GBP/USD toward 1.3220. Any more gains might call for a test of the 1.3320 zone.
Looking at EUR/USD, the bears remained active and were able to push the pair below the 1.0940 and 1.0920 support levels.
Upcoming Economic Events:
- UK Claimant Count Change for Sep 2024 – Forecast 20.2K, versus 23.7K previous.
- UK ILO Unemployment Rate for August 2024 (3M) – Forecast 4.1%, versus 4.1% previous.


